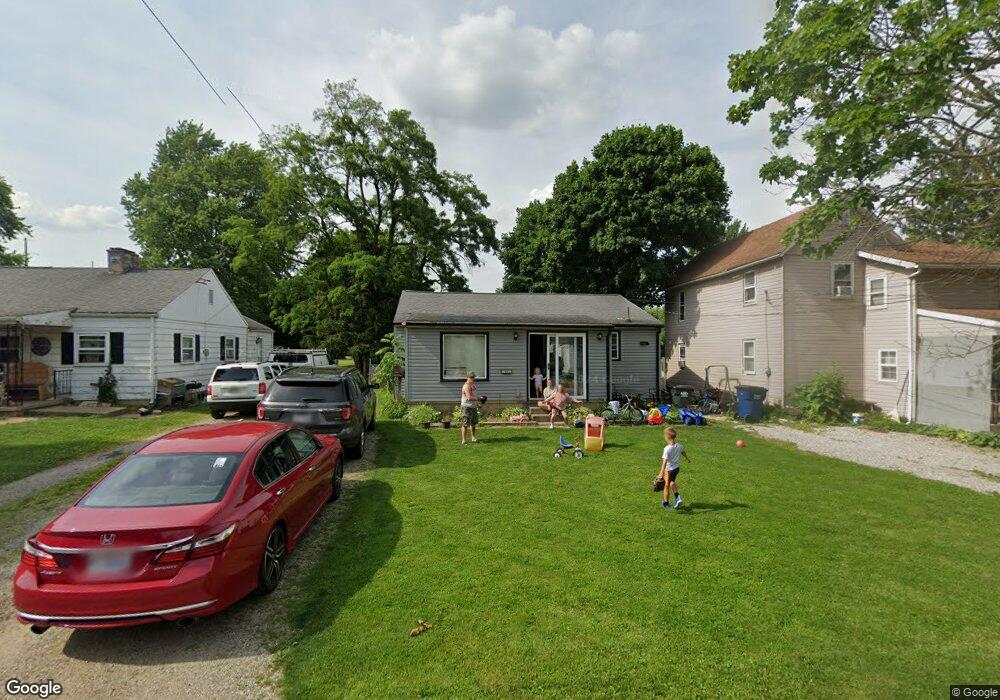
11 Summit St Shelby, OH 44875
Estimated Value: $99,000 - $137,000
2
Beds
2
Baths
780
Sq Ft
$153/Sq Ft
Est. Value
About This Home
This home is located at 11 Summit St, Shelby, OH 44875 and is currently estimated at $119,347, approximately $153 per square foot. 11 Summit St is a home located in Richland County with nearby schools including St. Mary's School.
Ownership History
Date
Name
Owned For
Owner Type
Purchase Details
Closed on
Dec 3, 2018
Sold by
Shank Debra K
Bought by
Shank Steven P and Shank Kelly J
Current Estimated Value
Purchase Details
Closed on
Jul 20, 2012
Sold by
Mechanics Bank
Bought by
Shank Debra K
Purchase Details
Closed on
Apr 4, 2012
Sold by
Gurik Max and Gurik Max T
Bought by
Mechanics Bank
Purchase Details
Closed on
Mar 22, 2010
Sold by
Gurik Sonjia and Gurik Max Nmi
Bought by
Gurik Max Nmi
Purchase Details
Closed on
Jun 11, 1993
Sold by
Gurick Michael A
Bought by
Gurik Max T
Create a Home Valuation Report for This Property
The Home Valuation Report is an in-depth analysis detailing your home's value as well as a comparison with similar homes in the area
Home Values in the Area
Average Home Value in this Area
Purchase History
| Date | Buyer | Sale Price | Title Company |
|---|---|---|---|
| Shank Steven P | $10,000 | None Available | |
| Shank Debra K | $22,000 | Chicago Title | |
| Mechanics Bank | -- | Chicago Title | |
| Gurik Max Nmi | -- | Attorney | |
| Gurik Max T | $15,000 | -- |
Source: Public Records
Tax History Compared to Growth
Tax History
| Year | Tax Paid | Tax Assessment Tax Assessment Total Assessment is a certain percentage of the fair market value that is determined by local assessors to be the total taxable value of land and additions on the property. | Land | Improvement |
|---|---|---|---|---|
| 2024 | $889 | $21,620 | $3,450 | $18,170 |
| 2023 | $847 | $21,620 | $3,450 | $18,170 |
| 2022 | $795 | $18,150 | $3,300 | $14,850 |
| 2021 | $795 | $18,150 | $3,300 | $14,850 |
| 2020 | $796 | $18,150 | $3,300 | $14,850 |
| 2019 | $748 | $15,660 | $2,800 | $12,860 |
| 2018 | $742 | $15,660 | $2,800 | $12,860 |
| 2017 | $735 | $15,660 | $2,800 | $12,860 |
| 2016 | $773 | $16,590 | $2,660 | $13,930 |
| 2015 | $773 | $16,590 | $2,660 | $13,930 |
| 2014 | $744 | $16,590 | $2,660 | $13,930 |
| 2012 | $366 | $16,590 | $2,800 | $13,790 |
Source: Public Records
Map
Nearby Homes