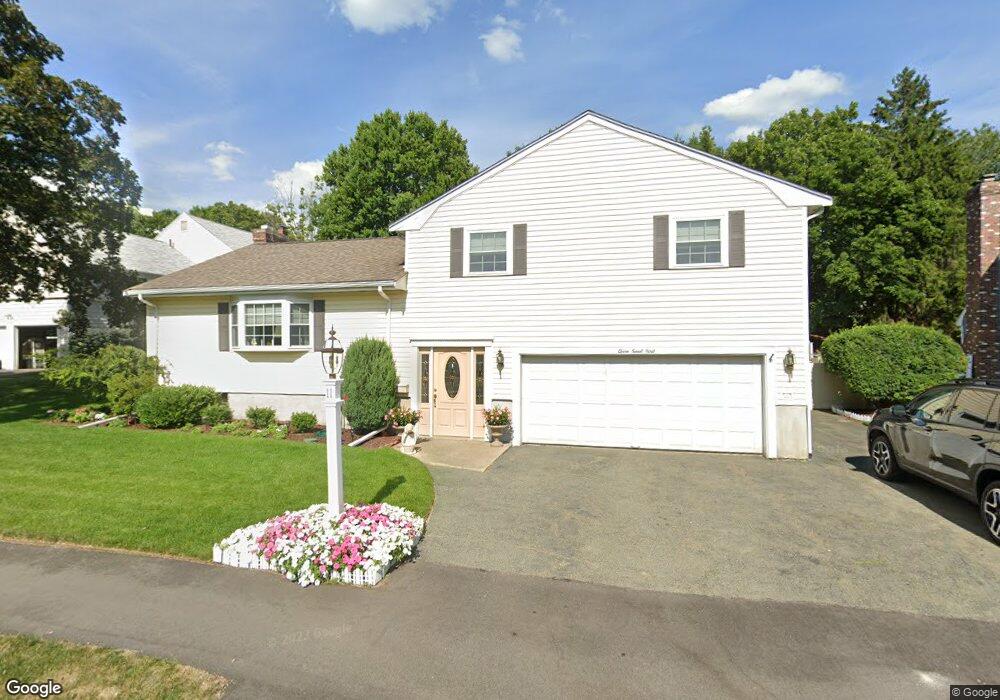
11 Sunset Rd Needham Heights, MA 02494
Estimated Value: $1,022,000 - $1,342,000
3
Beds
3
Baths
1,350
Sq Ft
$886/Sq Ft
Est. Value
About This Home
This home is located at 11 Sunset Rd, Needham Heights, MA 02494 and is currently estimated at $1,195,501, approximately $885 per square foot. 11 Sunset Rd is a home located in Norfolk County with nearby schools including Sunita L. Williams Elementary School, High Rock Middle School, and Pollard Middle School.
Ownership History
Date
Name
Owned For
Owner Type
Purchase Details
Closed on
Sep 25, 2019
Sold by
Payne William T and Payne Mary B
Bought by
William T Payne Sr Ret and Payne
Current Estimated Value
Purchase Details
Closed on
Aug 4, 1969
Bought by
Payne William T and Payne Mary B
Create a Home Valuation Report for This Property
The Home Valuation Report is an in-depth analysis detailing your home's value as well as a comparison with similar homes in the area
Home Values in the Area
Average Home Value in this Area
Purchase History
| Date | Buyer | Sale Price | Title Company |
|---|---|---|---|
| William T Payne Sr Ret | -- | -- | |
| William T Payne Sr Ret | -- | -- | |
| Payne William T | -- | -- |
Source: Public Records
Mortgage History
| Date | Status | Borrower | Loan Amount |
|---|---|---|---|
| Previous Owner | Payne William T | $303,000 |
Source: Public Records
Tax History
| Year | Tax Paid | Tax Assessment Tax Assessment Total Assessment is a certain percentage of the fair market value that is determined by local assessors to be the total taxable value of land and additions on the property. | Land | Improvement |
|---|---|---|---|---|
| 2025 | $10,401 | $981,200 | $743,500 | $237,700 |
| 2024 | $8,507 | $679,500 | $492,400 | $187,100 |
| 2023 | $8,689 | $666,300 | $492,400 | $173,900 |
| 2022 | $8,169 | $611,000 | $443,700 | $167,300 |
| 2021 | $7,961 | $611,000 | $443,700 | $167,300 |
| 2020 | $7,790 | $623,700 | $443,700 | $180,000 |
| 2019 | $7,211 | $582,000 | $403,500 | $178,500 |
| 2018 | $6,914 | $582,000 | $403,500 | $178,500 |
| 2017 | $6,650 | $559,300 | $403,500 | $155,800 |
| 2016 | $6,479 | $561,400 | $403,500 | $157,900 |
| 2015 | $6,338 | $561,400 | $403,500 | $157,900 |
| 2014 | $6,467 | $555,600 | $366,900 | $188,700 |
Source: Public Records
Map
Nearby Homes
- 12 Hill St
- 70 Briarwood Cir
- 36 Eliot Rd
- 81 Parish Rd
- 34 Pershing Rd
- 48 Taylor St
- 102 Jarvis Cir Unit 102
- 379 Hunnewell St Unit 379
- 140 Hillside Ave
- 140 Hillside Ave Unit a
- 3 Crescent Rd
- 134 Hillside Ave Unit 134
- 132 Hillside Ave
- 385 Hillside Ave
- 385 Hillside Ave Unit 385
- 100 Rosemary Way Unit 129
- 447 Hillside Ave
- 345 Central Ave
- 3 Hancock Rd
- 28 Mercer Rd
Your Personal Tour Guide
Ask me questions while you tour the home.