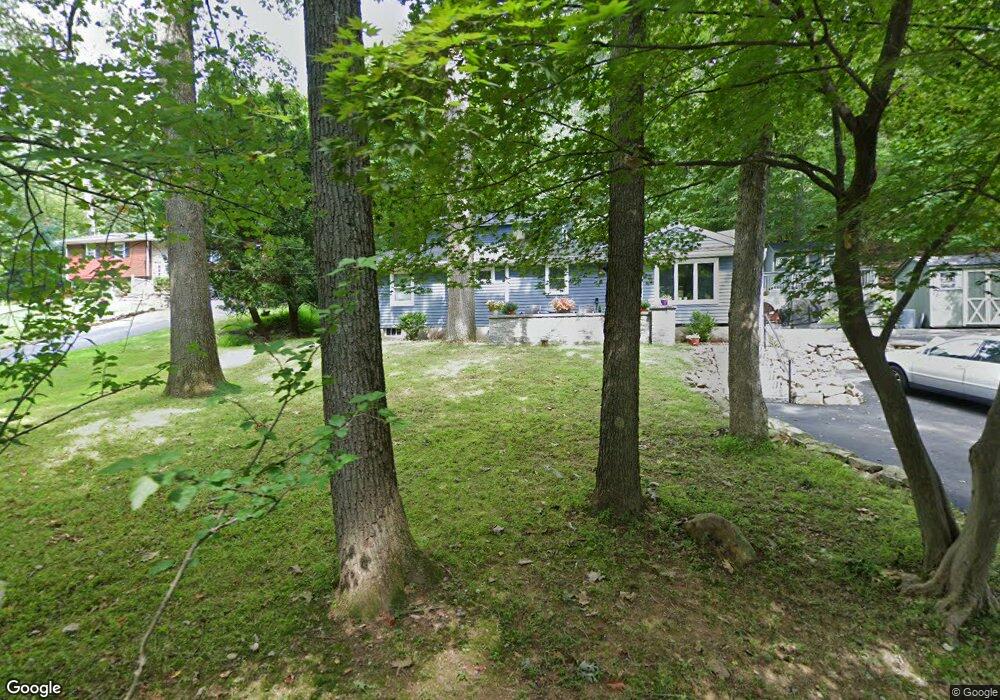
11 Superfine Rd High Bridge, NJ 08829
Estimated Value: $473,672 - $566,000
Studio
--
Bath
1,728
Sq Ft
$301/Sq Ft
Est. Value
About This Home
This home is located at 11 Superfine Rd, High Bridge, NJ 08829 and is currently estimated at $520,418, approximately $301 per square foot. 11 Superfine Rd is a home located in Hunterdon County with nearby schools including High Bridge Elementary School, High Bridge Middle School, and Voorhees High School.
Ownership History
Date
Name
Owned For
Owner Type
Purchase Details
Closed on
Aug 1, 2005
Sold by
Thompson Jack E and Thompson Heather H
Bought by
Thompson Heather H
Current Estimated Value
Purchase Details
Closed on
Apr 10, 1992
Sold by
Thompson Jack E and Thompson Heather H
Bought by
Thompson Jack E and Thompson Heather H
Purchase Details
Closed on
Mar 15, 1989
Sold by
Spakowski John W and Spakowski Josephine Q
Bought by
Thompson Jack E
Create a Home Valuation Report for This Property
The Home Valuation Report is an in-depth analysis detailing your home's value as well as a comparison with similar homes in the area
Home Values in the Area
Average Home Value in this Area
Purchase History
| Date | Buyer | Sale Price | Title Company |
|---|---|---|---|
| Thompson Heather H | -- | -- | |
| Thompson Jack E | -- | -- | |
| Thompson Jack E | $127,500 | -- |
Source: Public Records
Tax History
| Year | Tax Paid | Tax Assessment Tax Assessment Total Assessment is a certain percentage of the fair market value that is determined by local assessors to be the total taxable value of land and additions on the property. | Land | Improvement |
|---|---|---|---|---|
| 2025 | $11,819 | $342,000 | $171,500 | $170,500 |
| 2024 | $11,000 | $362,100 | $124,200 | $237,900 |
Source: Public Records
Map
Nearby Homes
Your Personal Tour Guide
Ask me questions while you tour the home.