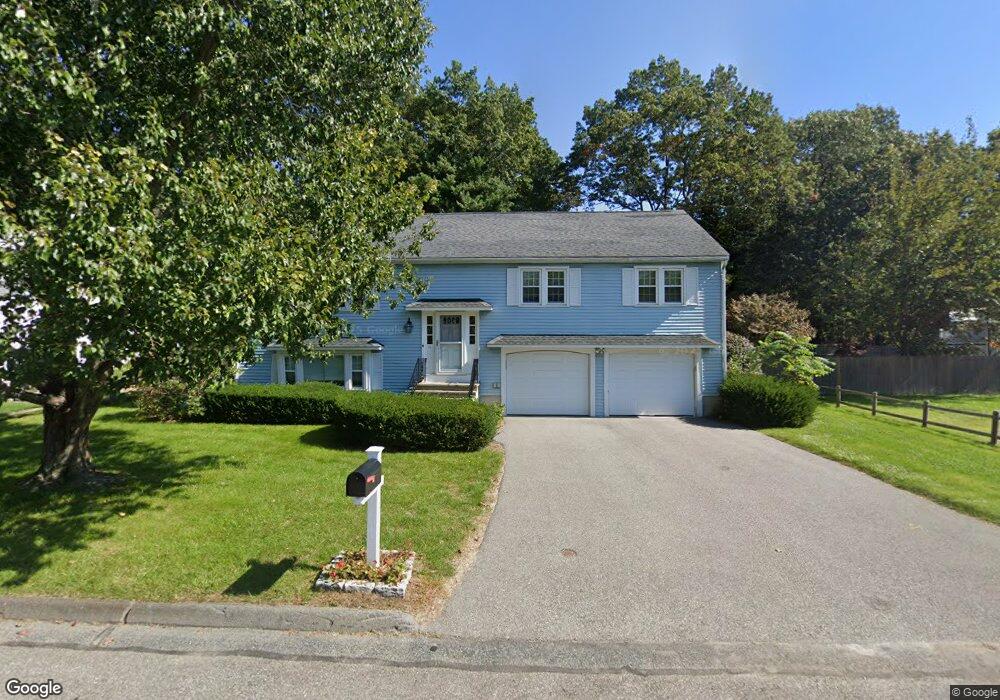
11 Surrey Ln Needham, MA 02492
Estimated Value: $1,104,000 - $1,459,000
3
Beds
3
Baths
1,456
Sq Ft
$902/Sq Ft
Est. Value
About This Home
This home is located at 11 Surrey Ln, Needham, MA 02492 and is currently estimated at $1,312,817, approximately $901 per square foot. 11 Surrey Ln is a home located in Norfolk County with nearby schools including Newman Elementary School, High Rock Middle School, and Pollard Middle School.
Ownership History
Date
Name
Owned For
Owner Type
Purchase Details
Closed on
Aug 16, 1996
Sold by
Flynn Mary Anne
Bought by
Preston Joyce R
Current Estimated Value
Purchase Details
Closed on
May 28, 1993
Sold by
Mcdoal Joseph P
Bought by
Flynn Mary Anne
Purchase Details
Closed on
Sep 13, 1990
Sold by
Baung Ju H
Bought by
Mcdoal Joseph P
Home Financials for this Owner
Home Financials are based on the most recent Mortgage that was taken out on this home.
Original Mortgage
$192,500
Interest Rate
9.76%
Mortgage Type
Purchase Money Mortgage
Create a Home Valuation Report for This Property
The Home Valuation Report is an in-depth analysis detailing your home's value as well as a comparison with similar homes in the area
Home Values in the Area
Average Home Value in this Area
Purchase History
We collect this data history from publicly available records. To have your information removed, we recommend requesting removal directly through your county’s website.
| Date | Buyer | Sale Price | Title Company |
|---|---|---|---|
| Preston Joyce R | $349,000 | -- | |
| Flynn Mary Anne | $270,000 | -- | |
| Mcdoal Joseph P | $292,500 | -- |
Source: Public Records
Mortgage History
We collect this data history from publicly available records. To have your information removed, we recommend requesting removal directly through your county’s website.
| Date | Status | Borrower | Loan Amount |
|---|---|---|---|
| Previous Owner | Mcdoal Joseph P | $192,500 |
Source: Public Records
Tax History
| Year | Tax Paid | Tax Assessment Tax Assessment Total Assessment is a certain percentage of the fair market value that is determined by local assessors to be the total taxable value of land and additions on the property. | Land | Improvement |
|---|---|---|---|---|
| 2025 | $11,703 | $1,104,100 | $755,600 | $348,500 |
| 2024 | $10,393 | $830,100 | $529,200 | $300,900 |
| 2023 | $10,485 | $804,100 | $529,200 | $274,900 |
| 2022 | $10,076 | $753,600 | $490,000 | $263,600 |
| 2021 | $9,819 | $753,600 | $490,000 | $263,600 |
| 2020 | $9,669 | $774,100 | $490,000 | $284,100 |
| 2019 | $8,963 | $723,400 | $445,500 | $277,900 |
| 2018 | $8,594 | $723,400 | $445,500 | $277,900 |
| 2017 | $8,206 | $690,200 | $445,500 | $244,700 |
| 2016 | $7,996 | $692,900 | $445,500 | $247,400 |
| 2015 | $7,823 | $692,900 | $445,500 | $247,400 |
| 2014 | $7,480 | $642,600 | $405,000 | $237,600 |
Source: Public Records
Map
Nearby Homes
- 64 Gayland Rd
- 8 Sutton Rd
- 957 South St
- 105 Blake St
- 18 Grant St Unit 2
- 34 Lincoln St Unit 34
- 238 Harris Ave
- 72 Marked Tree Rd
- 131 Fair Oaks Park
- 22 Barrett St
- 20 Burr Dr
- 5 Colonial Rd
- 620 High Rock St
- 19 Oakland Ave Unit 19
- 19 Oakland Ave
- 1360 Great Plain Ave
- 1362 Great Plain Ave Unit 1
- 34 Pond St
- 89 Green St
- 8 Crestview Rd
Your Personal Tour Guide
Ask me questions while you tour the home.