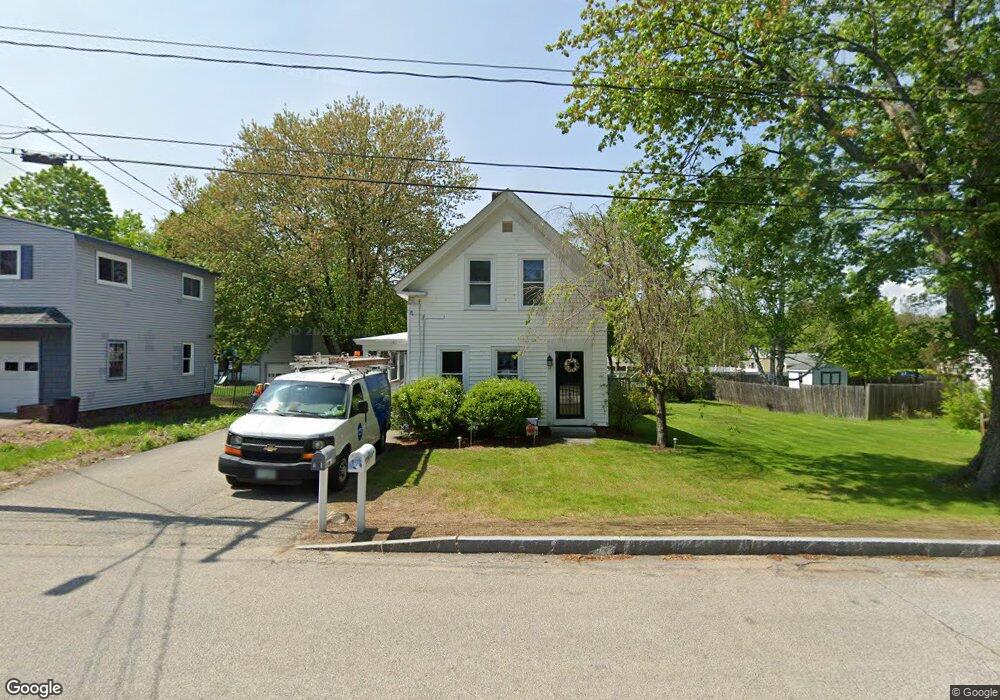
11 Sweetser St Berwick, ME 03901
Estimated Value: $366,000 - $435,000
3
Beds
1
Bath
1,616
Sq Ft
$245/Sq Ft
Est. Value
About This Home
This home is located at 11 Sweetser St, Berwick, ME 03901 and is currently estimated at $395,303, approximately $244 per square foot. 11 Sweetser St is a home located in York County with nearby schools including Noble High School and Tri-City Christian Academy.
Ownership History
Date
Name
Owned For
Owner Type
Purchase Details
Closed on
Aug 11, 2008
Sold by
Rogers Daniele H and Rogers John
Bought by
Connell Matthew A and Connell Christie A
Current Estimated Value
Home Financials for this Owner
Home Financials are based on the most recent Mortgage that was taken out on this home.
Original Mortgage
$198,534
Interest Rate
6.49%
Mortgage Type
FHA
Create a Home Valuation Report for This Property
The Home Valuation Report is an in-depth analysis detailing your home's value as well as a comparison with similar homes in the area
Home Values in the Area
Average Home Value in this Area
Purchase History
| Date | Buyer | Sale Price | Title Company |
|---|---|---|---|
| Connell Matthew A | -- | -- | |
| Connell Matthew A | -- | -- |
Source: Public Records
Mortgage History
| Date | Status | Borrower | Loan Amount |
|---|---|---|---|
| Open | Connell Matthew A | $205,619 | |
| Closed | Connell Matthew A | $198,534 |
Source: Public Records
Tax History
| Year | Tax Paid | Tax Assessment Tax Assessment Total Assessment is a certain percentage of the fair market value that is determined by local assessors to be the total taxable value of land and additions on the property. | Land | Improvement |
|---|---|---|---|---|
| 2025 | $4,251 | $326,000 | $113,700 | $212,300 |
| 2024 | $4,065 | $326,000 | $113,700 | $212,300 |
| 2023 | $3,831 | $209,100 | $81,200 | $127,900 |
| 2022 | $3,810 | $209,100 | $81,200 | $127,900 |
| 2021 | $3,827 | $209,100 | $81,200 | $127,900 |
| 2020 | $4,033 | $208,300 | $81,200 | $127,100 |
| 2019 | $3,651 | $208,300 | $81,200 | $127,100 |
| 2018 | $3,404 | $193,400 | $73,100 | $120,300 |
| 2017 | $3,317 | $193,400 | $73,100 | $120,300 |
| 2016 | $3,182 | $195,200 | $73,100 | $122,100 |
| 2014 | $3,104 | $195,200 | $73,100 | $122,100 |
| 2013 | $3,133 | $195,200 | $73,100 | $122,100 |
Source: Public Records
Map
Nearby Homes
Your Personal Tour Guide
Ask me questions while you tour the home.