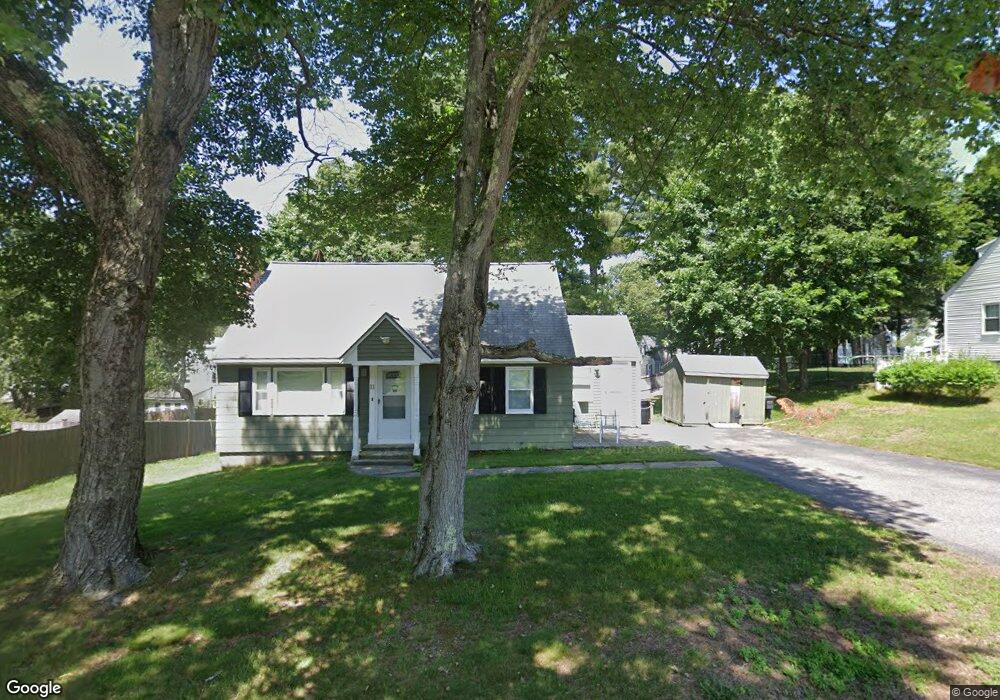
11 Sycamore Ln Walpole, MA 02081
Estimated Value: $613,000 - $677,000
3
Beds
2
Baths
1,344
Sq Ft
$478/Sq Ft
Est. Value
About This Home
This home is located at 11 Sycamore Ln, Walpole, MA 02081 and is currently estimated at $642,324, approximately $477 per square foot. 11 Sycamore Ln is a home located in Norfolk County with nearby schools including Elm Street School, Eleanor N. Johnson Middle School, and Walpole High School.
Ownership History
Date
Name
Owned For
Owner Type
Purchase Details
Closed on
Oct 21, 2004
Sold by
Moore Donald W and Moore Robert L
Bought by
Reader George C
Current Estimated Value
Home Financials for this Owner
Home Financials are based on the most recent Mortgage that was taken out on this home.
Original Mortgage
$220,000
Outstanding Balance
$109,539
Interest Rate
5.85%
Mortgage Type
Purchase Money Mortgage
Estimated Equity
$532,785
Create a Home Valuation Report for This Property
The Home Valuation Report is an in-depth analysis detailing your home's value as well as a comparison with similar homes in the area
Home Values in the Area
Average Home Value in this Area
Purchase History
| Date | Buyer | Sale Price | Title Company |
|---|---|---|---|
| Reader George C | $315,000 | -- |
Source: Public Records
Mortgage History
| Date | Status | Borrower | Loan Amount |
|---|---|---|---|
| Open | Reader George C | $220,000 |
Source: Public Records
Tax History
| Year | Tax Paid | Tax Assessment Tax Assessment Total Assessment is a certain percentage of the fair market value that is determined by local assessors to be the total taxable value of land and additions on the property. | Land | Improvement |
|---|---|---|---|---|
| 2025 | $6,795 | $529,600 | $316,800 | $212,800 |
| 2024 | $6,619 | $500,700 | $304,500 | $196,200 |
| 2023 | $6,441 | $463,700 | $264,900 | $198,800 |
| 2022 | $6,105 | $422,200 | $245,200 | $177,000 |
| 2021 | $5,765 | $388,500 | $231,400 | $157,100 |
| 2020 | $5,759 | $384,200 | $218,200 | $166,000 |
| 2019 | $5,575 | $369,200 | $209,900 | $159,300 |
| 2018 | $5,141 | $336,700 | $201,900 | $134,800 |
| 2017 | $4,970 | $324,200 | $194,200 | $130,000 |
| 2016 | $4,853 | $311,900 | $186,700 | $125,200 |
| 2015 | $4,679 | $298,000 | $177,500 | $120,500 |
| 2014 | $4,528 | $287,300 | $177,500 | $109,800 |
Source: Public Records
Map
Nearby Homes
- 9 Pearl St
- 1391 Main St Unit 308
- 1391 Main St Unit 306
- 1391 Main St Unit 304
- 10 Weathervane Dr Unit 20
- 3 Weathervane Dr Unit 1
- 13 Sandtrap Cir Unit 14
- 11 Sandtrap Cir Unit 15
- 20 Sandtrap Cir Unit 4
- 19 Sandtrap Cir Unit 11
- 14 Weathervane Dr Unit 22
- 18 Sandtrap Cir Unit 3
- 17 Sandtrap Cir Unit 12
- 15 Sandtrap Cir Unit 13
- 10 Sandtrap Cir Unit 2
- 31 Sandtrap Cir Unit 500
- 145 South St Unit 5
- 25 Sandtrap Cir Unit 8
- 29 Sandtrap Cir Unit 6
- 27 Sandtrap Cir Unit 7
Your Personal Tour Guide
Ask me questions while you tour the home.