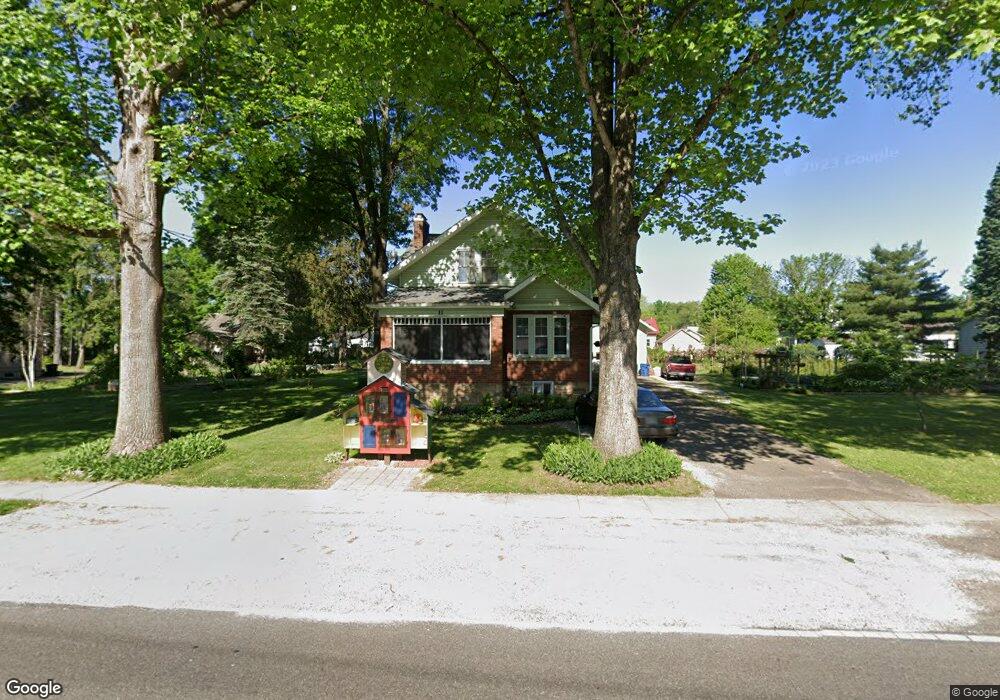
11 Sychar Rd Mount Vernon, OH 43050
Estimated Value: $261,000 - $306,000
3
Beds
2
Baths
1,995
Sq Ft
$138/Sq Ft
Est. Value
About This Home
This home is located at 11 Sychar Rd, Mount Vernon, OH 43050 and is currently estimated at $274,929, approximately $137 per square foot. 11 Sychar Rd is a home located in Knox County with nearby schools including Mount Vernon High School, St. Vincent de Paul School, and Christian Star Academy.
Ownership History
Date
Name
Owned For
Owner Type
Purchase Details
Closed on
Oct 15, 2009
Sold by
Donham James B and Katherine Donham T
Bought by
Fierst Andrew J
Current Estimated Value
Home Financials for this Owner
Home Financials are based on the most recent Mortgage that was taken out on this home.
Original Mortgage
$117,826
Interest Rate
4.48%
Mortgage Type
FHA
Purchase Details
Closed on
Aug 28, 1995
Sold by
Scott Ii John Laidlaw and Scott J
Bought by
Donham James B and Donham Kather T
Create a Home Valuation Report for This Property
The Home Valuation Report is an in-depth analysis detailing your home's value as well as a comparison with similar homes in the area
Home Values in the Area
Average Home Value in this Area
Purchase History
| Date | Buyer | Sale Price | Title Company |
|---|---|---|---|
| Fierst Andrew J | $97,425 | Valmer Land Title Agency Box | |
| Donham James B | $91,000 | -- |
Source: Public Records
Mortgage History
| Date | Status | Borrower | Loan Amount |
|---|---|---|---|
| Closed | Fierst Andrew J | $117,826 |
Source: Public Records
Tax History Compared to Growth
Tax History
| Year | Tax Paid | Tax Assessment Tax Assessment Total Assessment is a certain percentage of the fair market value that is determined by local assessors to be the total taxable value of land and additions on the property. | Land | Improvement |
|---|---|---|---|---|
| 2024 | $3,067 | $75,510 | $18,600 | $56,910 |
| 2023 | $2,921 | $75,510 | $18,600 | $56,910 |
| 2022 | $2,214 | $52,080 | $12,830 | $39,250 |
| 2021 | $2,214 | $52,080 | $12,830 | $39,250 |
| 2020 | $2,104 | $50,850 | $12,830 | $38,020 |
| 2019 | $1,892 | $42,620 | $13,850 | $28,770 |
| 2018 | $1,893 | $42,620 | $13,850 | $28,770 |
| 2017 | $1,859 | $42,620 | $13,850 | $28,770 |
| 2016 | $1,725 | $39,470 | $12,830 | $26,640 |
| 2015 | $1,732 | $39,470 | $12,830 | $26,640 |
| 2014 | $1,741 | $39,470 | $12,830 | $26,640 |
| 2013 | $1,860 | $40,150 | $10,410 | $29,740 |
Source: Public Records
Map
Nearby Homes