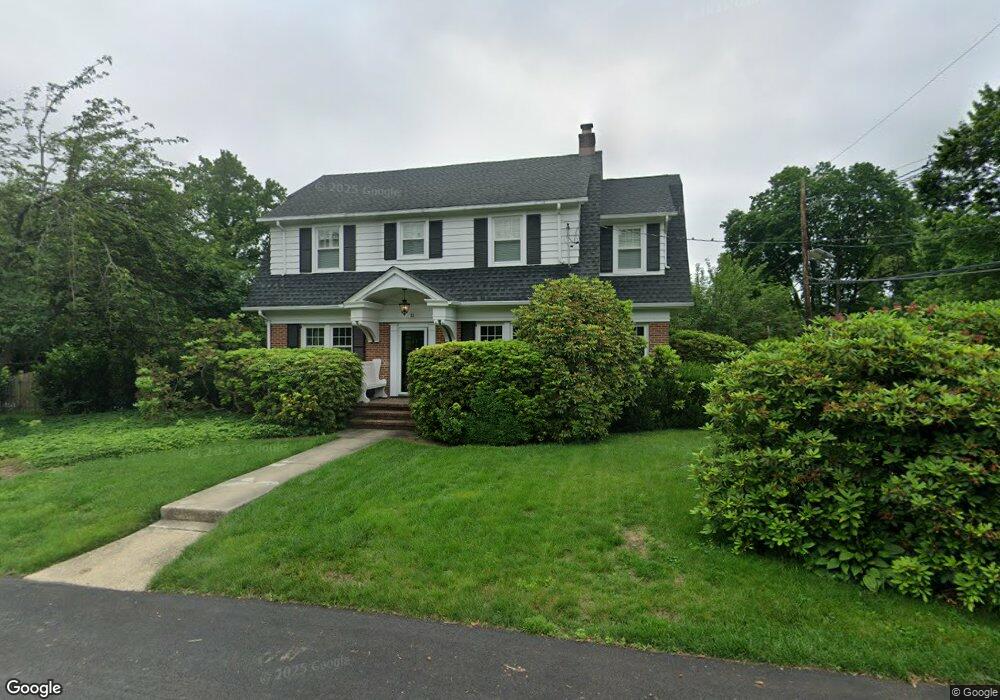
11 Symmes Ct Cranbury, NJ 08512
Estimated Value: $686,444 - $766,000
3
Beds
2
Baths
1,852
Sq Ft
$393/Sq Ft
Est. Value
About This Home
This home is located at 11 Symmes Ct, Cranbury, NJ 08512 and is currently estimated at $727,361, approximately $392 per square foot. 11 Symmes Ct is a home located in Middlesex County with nearby schools including The Cranbury School, SciCore Academy, and E Windsor Knowledge Beginnings.
Ownership History
Date
Name
Owned For
Owner Type
Purchase Details
Closed on
Feb 1, 2017
Sold by
Falk Jerry and Falk Bonnie
Bought by
Falk Allyson Kendal
Current Estimated Value
Purchase Details
Closed on
Oct 15, 2008
Sold by
Ingegneri Thomas and Moore Nicole
Bought by
Falk Jerry and Falk Bonnie
Purchase Details
Closed on
Sep 17, 2003
Sold by
Cendant Mobility Financial Cor
Bought by
Ingegneri Thomas and Nicole More
Home Financials for this Owner
Home Financials are based on the most recent Mortgage that was taken out on this home.
Original Mortgage
$176,000
Interest Rate
6.09%
Purchase Details
Closed on
Aug 25, 2003
Sold by
Overstreet Greg A
Bought by
Cendant Mobility Financial Cor
Home Financials for this Owner
Home Financials are based on the most recent Mortgage that was taken out on this home.
Original Mortgage
$176,000
Interest Rate
6.09%
Create a Home Valuation Report for This Property
The Home Valuation Report is an in-depth analysis detailing your home's value as well as a comparison with similar homes in the area
Home Values in the Area
Average Home Value in this Area
Purchase History
| Date | Buyer | Sale Price | Title Company |
|---|---|---|---|
| Falk Allyson Kendal | -- | None Available | |
| Falk Jerry | $517,000 | None Available | |
| Ingegneri Thomas | $470,000 | -- | |
| Cendant Mobility Financial Cor | $470,000 | -- |
Source: Public Records
Mortgage History
| Date | Status | Borrower | Loan Amount |
|---|---|---|---|
| Previous Owner | Ingegneri Thomas | $176,000 |
Source: Public Records
Tax History Compared to Growth
Tax History
| Year | Tax Paid | Tax Assessment Tax Assessment Total Assessment is a certain percentage of the fair market value that is determined by local assessors to be the total taxable value of land and additions on the property. | Land | Improvement |
|---|---|---|---|---|
| 2025 | $9,161 | $499,500 | $189,700 | $309,800 |
| 2024 | $9,031 | $499,500 | $189,700 | $309,800 |
| 2023 | $9,031 | $499,500 | $189,700 | $309,800 |
| 2022 | $8,901 | $499,500 | $189,700 | $309,800 |
| 2021 | $8,788 | $491,200 | $189,700 | $301,500 |
| 2020 | $8,743 | $491,200 | $189,700 | $301,500 |
| 2019 | $8,837 | $491,200 | $189,700 | $301,500 |
| 2018 | $9,672 | $491,200 | $189,700 | $301,500 |
| 2017 | $9,416 | $491,200 | $189,700 | $301,500 |
| 2016 | $9,495 | $491,200 | $189,700 | $301,500 |
| 2015 | $9,323 | $491,200 | $189,700 | $301,500 |
| 2014 | $9,357 | $491,200 | $189,700 | $301,500 |
Source: Public Records
Map
Nearby Homes
- 5 Arthur Ln
- 8 Arthur Ln
- 2 Arthur Ln
- 86 Labaw Dr
- 5 Trowbridge Ln
- 75 N Main St
- 110 S Main St
- 0-0 Route 130
- 6 Ryan Rd
- 24 Haymarket Ct
- 41 Haymarket Ct
- 2657 Route 130
- 14 Hightstown Cranbury Station Rd
- 15 Griffin Ln
- 17 Griffin Ln
- 47 Garden View Terrace Unit 4
- 47 Garden View Terrace
- 95 Halsey Reed Rd
- 148 Einstein Way
- 50 -18 Garden View Terrace