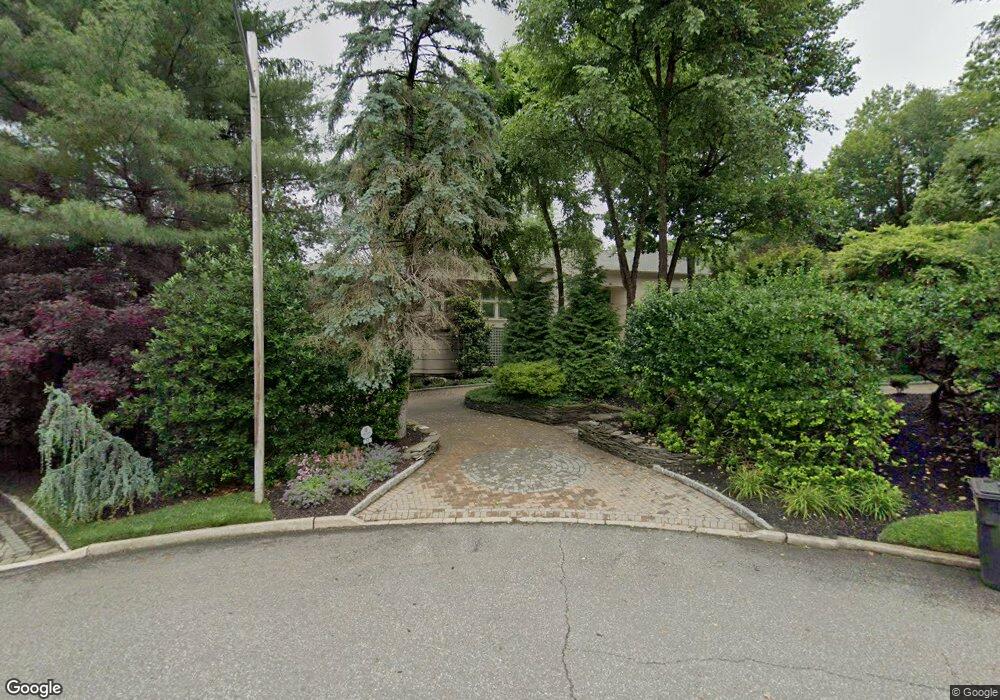
11 Tamarack Rd Alpine, NJ 07620
Estimated Value: $3,446,191 - $3,873,000
6
Beds
7
Baths
5,535
Sq Ft
$666/Sq Ft
Est. Value
About This Home
This home is located at 11 Tamarack Rd, Alpine, NJ 07620 and is currently estimated at $3,686,730, approximately $666 per square foot. 11 Tamarack Rd is a home located in Bergen County with nearby schools including Alpine Elementary School, Spring School, and Academy Of The Holy Angels.
Ownership History
Date
Name
Owned For
Owner Type
Purchase Details
Closed on
Dec 13, 2019
Sold by
Hu Jie and The Spring Revocable Trust
Bought by
Zhou Libo and Zhang Rui
Current Estimated Value
Purchase Details
Closed on
Jun 12, 2019
Sold by
Hu Jie and Zhou Libo
Bought by
Spring Ret
Purchase Details
Closed on
Dec 23, 2011
Sold by
Miller Amy and Miller William
Bought by
Zhou Libo and Hu Jie
Purchase Details
Closed on
Jul 12, 2000
Sold by
Goldman Sharon and Goldman Richard
Bought by
Miller Amy
Create a Home Valuation Report for This Property
The Home Valuation Report is an in-depth analysis detailing your home's value as well as a comparison with similar homes in the area
Home Values in the Area
Average Home Value in this Area
Purchase History
| Date | Buyer | Sale Price | Title Company |
|---|---|---|---|
| Zhou Libo | -- | None Available | |
| Spring Ret | -- | -- | |
| Zhou Libo | $4,300,000 | -- | |
| Miller Amy | $3,000,000 | First American Title Ins Co |
Source: Public Records
Tax History Compared to Growth
Tax History
| Year | Tax Paid | Tax Assessment Tax Assessment Total Assessment is a certain percentage of the fair market value that is determined by local assessors to be the total taxable value of land and additions on the property. | Land | Improvement |
|---|---|---|---|---|
| 2025 | $23,634 | $2,889,300 | $1,505,000 | $1,384,300 |
| 2024 | $22,825 | $2,889,300 | $1,505,000 | $1,384,300 |
| 2023 | $22,161 | $2,889,300 | $1,505,000 | $1,384,300 |
| 2022 | $22,161 | $2,889,300 | $1,505,000 | $1,384,300 |
| 2021 | $22,450 | $2,889,300 | $1,505,000 | $1,384,300 |
| 2020 | $21,930 | $2,889,300 | $1,505,000 | $1,384,300 |
| 2019 | $22,508 | $2,889,300 | $1,505,000 | $1,384,300 |
| 2018 | $22,421 | $2,889,300 | $1,505,000 | $1,384,300 |
| 2017 | $23,143 | $2,889,300 | $1,505,000 | $1,384,300 |
| 2016 | $22,190 | $2,889,300 | $1,505,000 | $1,384,300 |
| 2015 | $22,248 | $2,889,300 | $1,505,000 | $1,384,300 |
| 2014 | $21,410 | $2,889,300 | $1,505,000 | $1,384,300 |
Source: Public Records
Map
Nearby Homes