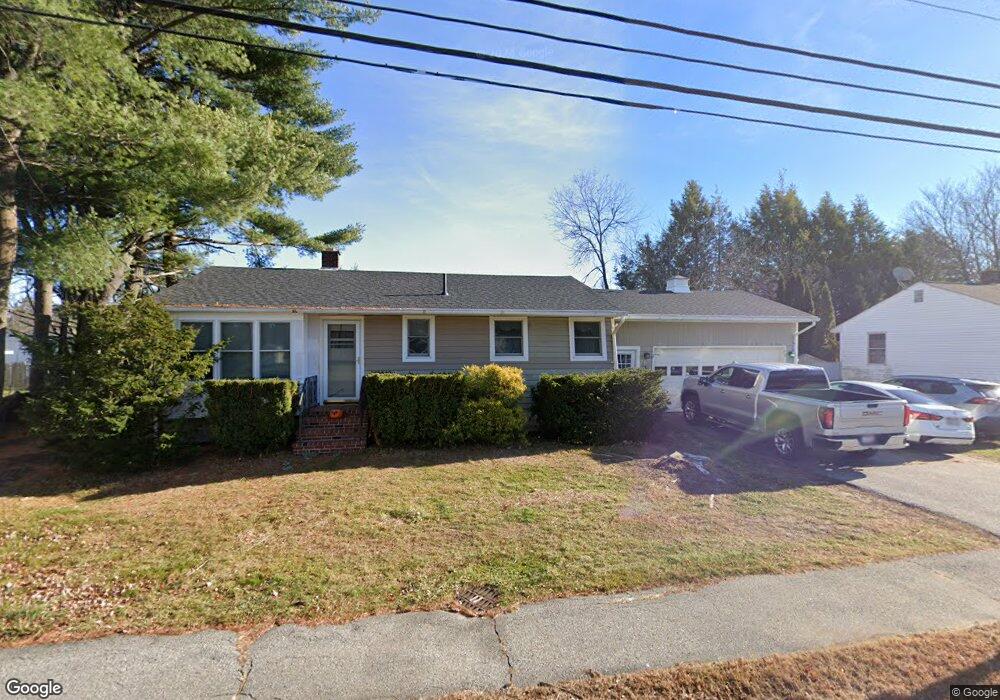
11 Tasker St Unit 9 Saco, ME 04072
Central Saco NeighborhoodEstimated Value: $474,000 - $501,000
3
Beds
3
Baths
1,800
Sq Ft
$269/Sq Ft
Est. Value
About This Home
This home is located at 11 Tasker St Unit 9, Saco, ME 04072 and is currently estimated at $484,906, approximately $269 per square foot. 11 Tasker St Unit 9 is a home located in York County with nearby schools including C K Burns School, Saco Middle School, and Saint James School.
Ownership History
Date
Name
Owned For
Owner Type
Purchase Details
Closed on
Jan 31, 2022
Sold by
Beaumont Colette M and Ncnally Roderick C
Bought by
Beaumont Colette M
Current Estimated Value
Home Financials for this Owner
Home Financials are based on the most recent Mortgage that was taken out on this home.
Original Mortgage
$235,700
Outstanding Balance
$217,751
Interest Rate
3.45%
Mortgage Type
Purchase Money Mortgage
Estimated Equity
$267,155
Purchase Details
Closed on
May 9, 2019
Sold by
Leblanc Lynda A
Bought by
Beaumont Colette M and Mcnally Roderick C
Home Financials for this Owner
Home Financials are based on the most recent Mortgage that was taken out on this home.
Original Mortgage
$240,000
Interest Rate
4%
Mortgage Type
New Conventional
Create a Home Valuation Report for This Property
The Home Valuation Report is an in-depth analysis detailing your home's value as well as a comparison with similar homes in the area
Home Values in the Area
Average Home Value in this Area
Purchase History
| Date | Buyer | Sale Price | Title Company |
|---|---|---|---|
| Beaumont Colette M | -- | None Available | |
| Beaumont Colette M | -- | None Available | |
| Beaumont Colette M | -- | None Available | |
| Beaumont Colette M | -- | -- | |
| Beaumont Colette M | -- | -- | |
| Beaumont Colette M | -- | -- |
Source: Public Records
Mortgage History
| Date | Status | Borrower | Loan Amount |
|---|---|---|---|
| Open | Beaumont Colette M | $235,700 | |
| Closed | Beaumont Colette M | $235,700 | |
| Previous Owner | Beaumont Colette M | $240,000 |
Source: Public Records
Tax History
| Year | Tax Paid | Tax Assessment Tax Assessment Total Assessment is a certain percentage of the fair market value that is determined by local assessors to be the total taxable value of land and additions on the property. | Land | Improvement |
|---|---|---|---|---|
| 2024 | $5,002 | $356,000 | $101,900 | $254,100 |
| 2023 | $5,255 | $356,300 | $102,200 | $254,100 |
| 2022 | $4,691 | $255,900 | $77,900 | $178,000 |
| 2021 | $4,478 | $237,200 | $71,700 | $165,500 |
| 2020 | $4,266 | $216,900 | $68,600 | $148,300 |
| 2019 | $4,204 | $216,900 | $68,600 | $148,300 |
| 2018 | $3,867 | $210,600 | $62,300 | $148,300 |
| 2017 | $4,087 | $230,900 | $62,300 | $168,600 |
| 2016 | $4,158 | $214,100 | $52,200 | $161,900 |
| 2015 | $4,115 | $214,100 | $52,200 | $161,900 |
| 2014 | $3,987 | $214,100 | $52,200 | $161,900 |
| 2013 | $3,978 | $214,100 | $52,200 | $161,900 |
Source: Public Records
Map
Nearby Homes
- 22 Tasker St Unit 11
- 7 Pleasant View Dr
- 5 Brentwood Cir
- 8 Oakland St
- 34 Pepperell St
- 27 Pepperell St Unit 1
- 7 Hubbard St
- TBD Oakland St
- 224 North St Unit 105
- 6 Lina Ave
- 241 Lincoln St
- 24 Dyer St
- 242 Lincoln St
- 120 Lincoln St
- 9 Nottingham Dr
- 00 Sawyer St
- 8 Nottingham Dr
- 5 Blaine St Unit 101
- 5 Blaine St Unit 104
- 5 Blaine St Unit 102
- 11 Tasker St Unit 15
- 11 Tasker St Unit 14
- 11 Tasker St Unit 13
- 11 Tasker St Unit 12
- 11 Tasker St
- 11 Tasker St Unit 10
- 11 Tasker St Unit 8
- 11 Tasker St Unit 7
- 11 Tasker St Unit 6
- 11 Tasker St Unit 5
- 11 Tasker St Unit 4
- 11 Tasker St Unit 3
- 11 Tasker St Unit 2
- 11 Tasker St Unit 1
- 11 Tasker St Unit 11
- 22 Tasker St Unit 13
- 22 Tasker St Unit 12
- 22 Tasker St Unit 9
- 22 Tasker St Unit 2
- 22 Tasker St Unit 8
Your Personal Tour Guide
Ask me questions while you tour the home.