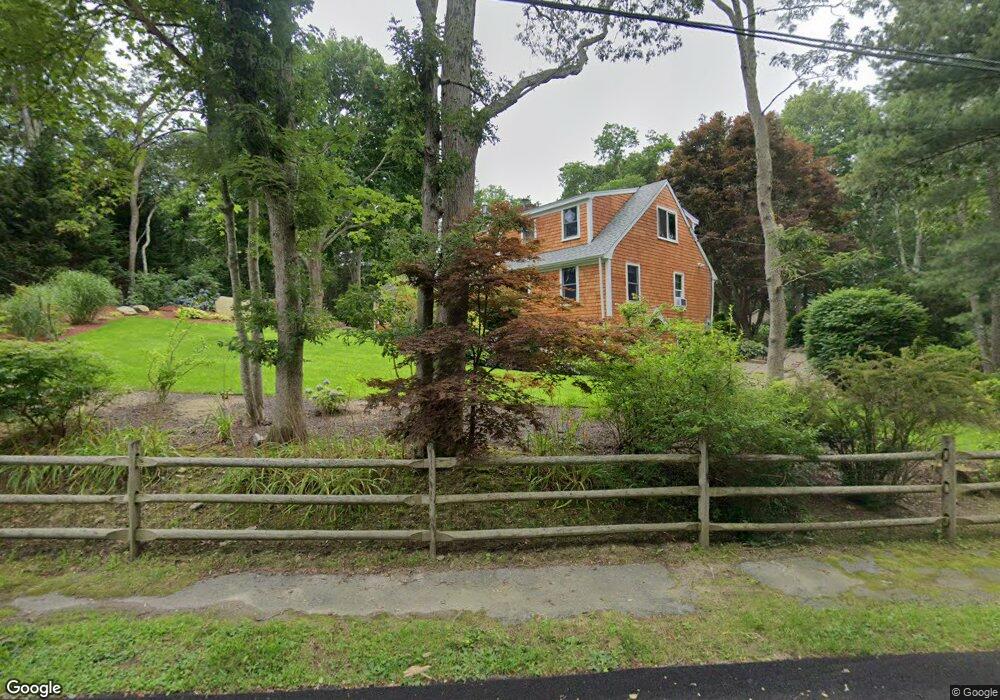
11 Teneycke Hill Rd North Falmouth, MA 02556
North Falmouth NeighborhoodEstimated Value: $957,000 - $1,168,000
3
Beds
3
Baths
3,592
Sq Ft
$294/Sq Ft
Est. Value
About This Home
This home is located at 11 Teneycke Hill Rd, North Falmouth, MA 02556 and is currently estimated at $1,055,511, approximately $293 per square foot. 11 Teneycke Hill Rd is a home located in Barnstable County with nearby schools including North Falmouth Elementary School, Morse Pond School, and Lawrence School.
Ownership History
Date
Name
Owned For
Owner Type
Purchase Details
Closed on
Feb 2, 2018
Sold by
Tierney Giannina and Breshin Jerrold
Bought by
Jerrold Breshin Ret and Breshin
Current Estimated Value
Purchase Details
Closed on
Aug 28, 1998
Sold by
Brereton Richard S
Bought by
Tierney Giannina
Create a Home Valuation Report for This Property
The Home Valuation Report is an in-depth analysis detailing your home's value as well as a comparison with similar homes in the area
Home Values in the Area
Average Home Value in this Area
Purchase History
| Date | Buyer | Sale Price | Title Company |
|---|---|---|---|
| Jerrold Breshin Ret | -- | -- | |
| Jerrold Breshin Ret | -- | -- | |
| Tierney Giannina | $177,000 | -- | |
| Tierney Giannina | $177,000 | -- |
Source: Public Records
Mortgage History
| Date | Status | Borrower | Loan Amount |
|---|---|---|---|
| Previous Owner | Tierney Giannina | $81,938 | |
| Previous Owner | Tierney Giannina | $90,000 |
Source: Public Records
Tax History Compared to Growth
Tax History
| Year | Tax Paid | Tax Assessment Tax Assessment Total Assessment is a certain percentage of the fair market value that is determined by local assessors to be the total taxable value of land and additions on the property. | Land | Improvement |
|---|---|---|---|---|
| 2025 | $5,685 | $968,500 | $295,300 | $673,200 |
| 2024 | $4,422 | $704,200 | $258,400 | $445,800 |
| 2023 | $4,060 | $586,700 | $203,000 | $383,700 |
| 2022 | $3,923 | $487,300 | $178,900 | $308,400 |
| 2021 | $3,546 | $417,200 | $164,000 | $253,200 |
| 2020 | $3,456 | $402,300 | $149,100 | $253,200 |
| 2019 | $3,290 | $384,300 | $149,100 | $235,200 |
| 2018 | $3,227 | $371,200 | $149,100 | $222,100 |
| 2017 | $3,103 | $363,800 | $149,100 | $214,700 |
| 2016 | $3,045 | $363,800 | $149,100 | $214,700 |
| 2015 | $2,980 | $363,800 | $149,100 | $214,700 |
| 2014 | $3,015 | $369,900 | $156,900 | $213,000 |
Source: Public Records
Map
Nearby Homes
- 267 N Falmouth Hwy
- 213 N Falmouth Hwy Unit 5A
- 213 N Falmouth Hwy Unit 5B
- 213 N Falmouth Hwy Unit 5 A
- 104 Streeter Hill Rd
- 121 Streeter Hill Rd
- 121 Streeter Hill Rd
- 104 Streeter Hill Rd
- 234 Cairn Ridge Rd
- 77 Highwood Ln
- 308 Falmouth Woods Rd
- 908 W Falmouth Hwy
- 2 Tricia Rd
- 345 Quaker Rd
- 0 Quaker Rd Unit 22504204
- 0 Quaker Rd Unit 73423088
- 74 Hillside Ave
- 850 W Falmouth Hwy Unit 11
- 14 Ryder Rd
- 37 Five Gate Ln
- 17 Teneycke Hill Rd
- 8 Teneycke Hill Rd
- 16 Teneycke Hill Rd
- 21 Teneycke Hill Rd
- 27 Althea Rd
- 20 Teneycke Hill Rd
- 35 Althea Rd
- 6 Teneycke Hill Rd
- 7 Tricket St
- 21 Althea Rd
- 23 Teneycke Hill Rd
- 7 Trickett St
- 43 Althea Rd
- 24 Teneycke Hill Rd
- 8 Trickett St
- 8 Tricket St
- 15 Althea Rd
- 25 Teneycke Hill Rd
- 0 Trickett St
- 32 Althea Rd