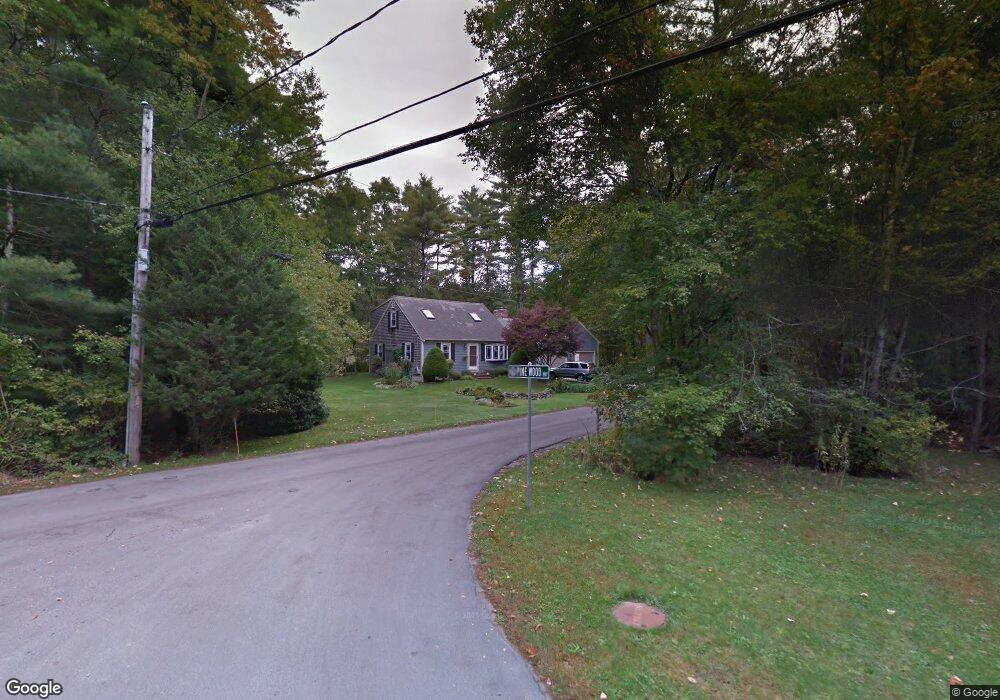
11 Tinkham Ln Mattapoisett, MA 02739
Estimated Value: $650,277 - $733,000
4
Beds
2
Baths
1,849
Sq Ft
$368/Sq Ft
Est. Value
About This Home
This home is located at 11 Tinkham Ln, Mattapoisett, MA 02739 and is currently estimated at $681,319, approximately $368 per square foot. 11 Tinkham Ln is a home located in Plymouth County with nearby schools including Center School, Old Hammondtown Elementary, and Old Rochester Regional High School.
Ownership History
Date
Name
Owned For
Owner Type
Purchase Details
Closed on
Jul 2, 1996
Sold by
Kearns James E and Kearns Elizabeth B
Bought by
Norton David A and Norton Colleen A
Current Estimated Value
Create a Home Valuation Report for This Property
The Home Valuation Report is an in-depth analysis detailing your home's value as well as a comparison with similar homes in the area
Home Values in the Area
Average Home Value in this Area
Purchase History
| Date | Buyer | Sale Price | Title Company |
|---|---|---|---|
| Norton David A | $174,900 | -- | |
| Norton David A | $174,900 | -- |
Source: Public Records
Mortgage History
| Date | Status | Borrower | Loan Amount |
|---|---|---|---|
| Open | Norton David A | $305,020 | |
| Closed | Norton David A | $75,000 | |
| Closed | Norton David A | $210,000 |
Source: Public Records
Tax History Compared to Growth
Tax History
| Year | Tax Paid | Tax Assessment Tax Assessment Total Assessment is a certain percentage of the fair market value that is determined by local assessors to be the total taxable value of land and additions on the property. | Land | Improvement |
|---|---|---|---|---|
| 2025 | $5,407 | $502,500 | $182,900 | $319,600 |
| 2024 | $5,372 | $511,100 | $182,900 | $328,200 |
| 2023 | $5,763 | $512,300 | $179,700 | $332,600 |
| 2022 | $5,514 | $444,700 | $151,700 | $293,000 |
| 2021 | $5,043 | $389,100 | $151,700 | $237,400 |
| 2020 | $4,759 | $352,800 | $145,100 | $207,700 |
| 2019 | $4,592 | $347,600 | $137,500 | $210,100 |
| 2018 | $4,713 | $362,000 | $146,000 | $216,000 |
| 2017 | $4,601 | $352,000 | $146,000 | $206,000 |
| 2016 | $4,204 | $318,500 | $132,500 | $186,000 |
| 2015 | $4,141 | $318,500 | $132,500 | $186,000 |
| 2014 | $4,028 | $316,700 | $132,500 | $184,200 |
Source: Public Records
Map
Nearby Homes
- 0 Long Plain Rd
- 225 Mattapoisett Rd
- 7 Laura Ln
- 8 Abby Ln
- 312 New Boston Rd
- 224 North St
- 293 Mendall Rd
- 13 Park Place
- 16 Brookside Dr
- 83 Fairhaven Rd
- 47 Fairhaven Rd
- 3 Brandt Island Rd
- 9 Hitching Post Rd
- 421 Huttleston Ave
- 19 High Ridge Dr
- 2 Golf Cottage Way
- 4 Golf Cottage Way
- 20 Forestview Dr
- 35 North St
- 7 Pearl St