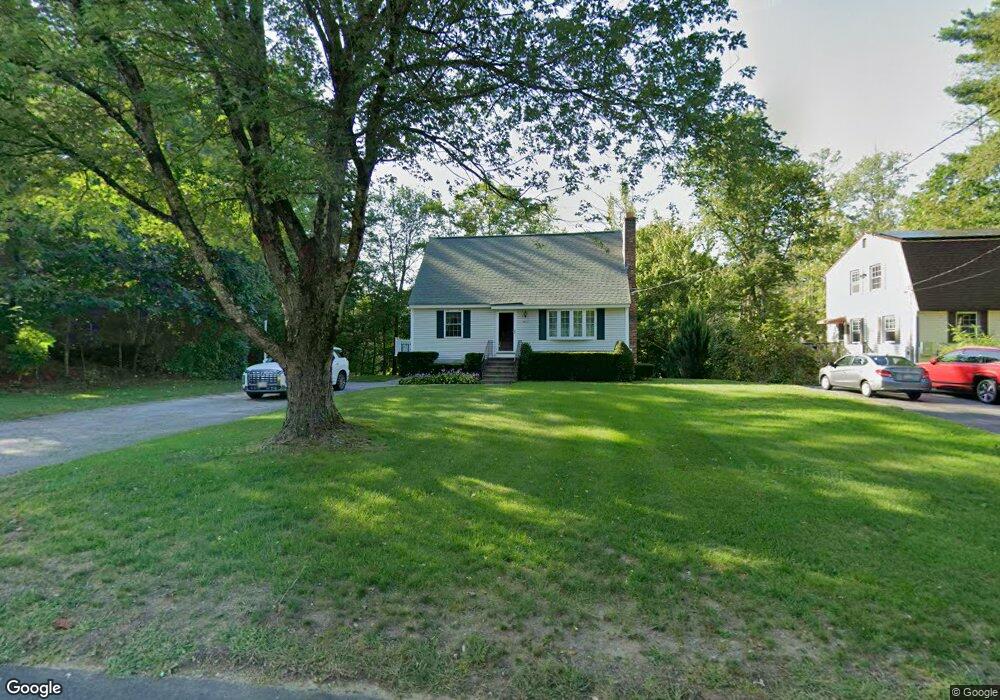
11 Todd Dr Townsend, MA 01469
Estimated Value: $430,000 - $467,000
3
Beds
2
Baths
1,820
Sq Ft
$244/Sq Ft
Est. Value
About This Home
This home is located at 11 Todd Dr, Townsend, MA 01469 and is currently estimated at $444,566, approximately $244 per square foot. 11 Todd Dr is a home located in Middlesex County with nearby schools including North Middlesex Regional High School.
Ownership History
Date
Name
Owned For
Owner Type
Purchase Details
Closed on
Sep 2, 2015
Sold by
Carroll Francis X
Bought by
Francis X Carroll Jr T
Current Estimated Value
Purchase Details
Closed on
Aug 20, 2003
Sold by
Howell Elizabeth Ann and Carroll Elizabeth Ann
Bought by
Carroll Elizabeth Ann and Carroll Francis X
Purchase Details
Closed on
Apr 19, 1977
Bought by
Francis X Carroll Jr T
Create a Home Valuation Report for This Property
The Home Valuation Report is an in-depth analysis detailing your home's value as well as a comparison with similar homes in the area
Home Values in the Area
Average Home Value in this Area
Purchase History
| Date | Buyer | Sale Price | Title Company |
|---|---|---|---|
| Francis X Carroll Jr T | -- | -- | |
| Carroll Elizabeth Ann | -- | -- | |
| Francis X Carroll Jr T | $30,400 | -- |
Source: Public Records
Mortgage History
| Date | Status | Borrower | Loan Amount |
|---|---|---|---|
| Previous Owner | Francis X Carroll Jr T | $45,000 | |
| Previous Owner | Francis X Carroll Jr T | $35,000 |
Source: Public Records
Tax History
| Year | Tax Paid | Tax Assessment Tax Assessment Total Assessment is a certain percentage of the fair market value that is determined by local assessors to be the total taxable value of land and additions on the property. | Land | Improvement |
|---|---|---|---|---|
| 2025 | $5,060 | $348,500 | $91,300 | $257,200 |
| 2024 | $4,925 | $341,800 | $91,300 | $250,500 |
| 2023 | $4,857 | $318,300 | $78,900 | $239,400 |
| 2022 | $4,809 | $273,100 | $72,200 | $200,900 |
| 2021 | $4,698 | $256,300 | $71,400 | $184,900 |
| 2020 | $4,536 | $232,400 | $64,700 | $167,700 |
| 2019 | $4,334 | $224,200 | $64,700 | $159,500 |
| 2018 | $4,119 | $203,300 | $58,100 | $145,200 |
| 2017 | $3,903 | $198,400 | $61,000 | $137,400 |
| 2016 | $3,762 | $190,000 | $61,000 | $129,000 |
| 2015 | $3,665 | $191,800 | $67,700 | $124,100 |
| 2014 | $3,485 | $178,100 | $63,500 | $114,600 |
Source: Public Records
Map
Nearby Homes
- 18 Beech St
- 2 Blueberry Hill Rd
- 43 Shattuck St
- 143 Heald St
- 21 Magnolia Ln
- 1 Depot Street Extension Unit 5
- 1 Depot Street Extension Unit 2
- 1 Depot Street Extension Unit 4
- 120 Townsend St Unit 1
- 120 Townsend St Unit 2
- 109 Townsend St
- Lot 10 Christian Cir
- 18 Maple St Unit 14
- 5 Turnpike Rd Unit 213 TWO
- 0 Brookline St
- 16 Worcester Rd
- 364 Townsend Hill Rd
- 90 Townsend St
- 39 Mount Lebanon St
- 10 Boynton St
Your Personal Tour Guide
Ask me questions while you tour the home.