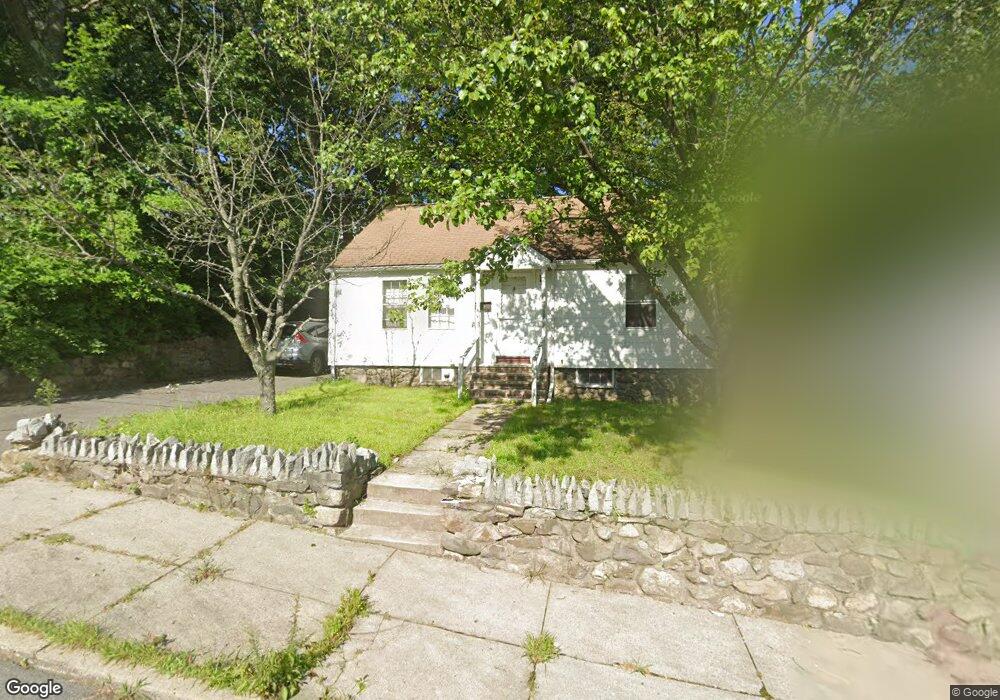
11 Tower Hill St Lawrence, MA 01841
Tower Hill NeighborhoodEstimated Value: $379,292 - $501,000
2
Beds
1
Bath
922
Sq Ft
$465/Sq Ft
Est. Value
About This Home
This home is located at 11 Tower Hill St, Lawrence, MA 01841 and is currently estimated at $428,823, approximately $465 per square foot. 11 Tower Hill St is a home located in Essex County with nearby schools including Gerard A. Guilmette School, School For Exceptional Studies, and Lawrence Family Development Charter School.
Ownership History
Date
Name
Owned For
Owner Type
Purchase Details
Closed on
Sep 16, 2003
Sold by
Choroco Walter E
Bought by
Selman Peter R
Current Estimated Value
Home Financials for this Owner
Home Financials are based on the most recent Mortgage that was taken out on this home.
Original Mortgage
$123,750
Outstanding Balance
$57,329
Interest Rate
6.22%
Mortgage Type
Purchase Money Mortgage
Estimated Equity
$371,494
Purchase Details
Closed on
Aug 28, 1997
Sold by
Marquis Tina A
Bought by
Choroco Walter C
Home Financials for this Owner
Home Financials are based on the most recent Mortgage that was taken out on this home.
Original Mortgage
$50,400
Interest Rate
7.41%
Mortgage Type
Purchase Money Mortgage
Purchase Details
Closed on
Mar 27, 1995
Sold by
Cornwell Maureen
Bought by
Marguis Tina
Home Financials for this Owner
Home Financials are based on the most recent Mortgage that was taken out on this home.
Original Mortgage
$35,850
Interest Rate
8.78%
Mortgage Type
Purchase Money Mortgage
Create a Home Valuation Report for This Property
The Home Valuation Report is an in-depth analysis detailing your home's value as well as a comparison with similar homes in the area
Home Values in the Area
Average Home Value in this Area
Purchase History
We collect this data history from publicly available records. To have your information removed, we recommend requesting removal directly through your county’s website.
| Date | Buyer | Sale Price | Title Company |
|---|---|---|---|
| Selman Peter R | $165,000 | -- | |
| Choroco Walter C | $56,000 | -- | |
| Marguis Tina | $37,000 | -- |
Source: Public Records
Mortgage History
We collect this data history from publicly available records. To have your information removed, we recommend requesting removal directly through your county’s website.
| Date | Status | Borrower | Loan Amount |
|---|---|---|---|
| Open | Selman Peter R | $123,750 | |
| Previous Owner | Marguis Tina | $50,400 | |
| Previous Owner | Marguis Tina | $35,850 |
Source: Public Records
Tax History
| Year | Tax Paid | Tax Assessment Tax Assessment Total Assessment is a certain percentage of the fair market value that is determined by local assessors to be the total taxable value of land and additions on the property. | Land | Improvement |
|---|---|---|---|---|
| 2025 | $3,046 | $346,100 | $121,200 | $224,900 |
| 2024 | $2,954 | $319,300 | $117,200 | $202,100 |
| 2023 | $2,969 | $292,200 | $102,700 | $189,500 |
| 2022 | $2,918 | $255,100 | $95,400 | $159,700 |
| 2021 | $2,752 | $224,300 | $95,400 | $128,900 |
| 2020 | $2,547 | $204,900 | $80,800 | $124,100 |
| 2019 | $2,454 | $179,400 | $69,900 | $109,500 |
| 2018 | $2,323 | $162,200 | $66,800 | $95,400 |
| 2017 | $2,178 | $142,000 | $64,500 | $77,500 |
| 2016 | $1,988 | $128,200 | $45,800 | $82,400 |
| 2015 | $1,938 | $128,200 | $45,800 | $82,400 |
Source: Public Records
Map
Nearby Homes
- 117 Pearl St
- 0 Hudson Ave
- 100 Hancock St
- 312 Water St Unit 33
- 13 Caswell Ave
- 2 Andover Terrace
- 110-112 Everett St
- 4 Bicknell Terrace
- 11 Crescent St
- 15 Crescent St Unit D
- 22-26 Chandler St
- 66-68 Water St
- 82-84 Haverhill St
- 8 Glen Forest Ln
- 246 Salem St
- 14 Tyler St Unit 1
- 202 Broadway Unit 2-3
- 202 Broadway Unit 3-2
- 86 S Broadway
- 82 S Broadway
- 9 Tower Hill St
- 70 Oregon Ave
- 77 Oregon Ave
- 7 Tower Hill St
- 4 Tower Hill St
- 28 Nesmith St Unit 30
- 28-30 Nesmith St
- 21 Tower Hill St
- 24 Nesmith St Unit 26
- 24-26 Nesmith St
- 459 Riverside Dr
- 66-68 Texas Ave
- 461 Riverside Dr
- 34 Nesmith St
- 453 Riverside Dr Unit 455
- 20 Nesmith St Unit 22
- 12 Tower Hill St
- 20-22 Nesmith St
- 453-455 Riverside Dr
- 66 Texas Ave Unit 68
Your Personal Tour Guide
Ask me questions while you tour the home.