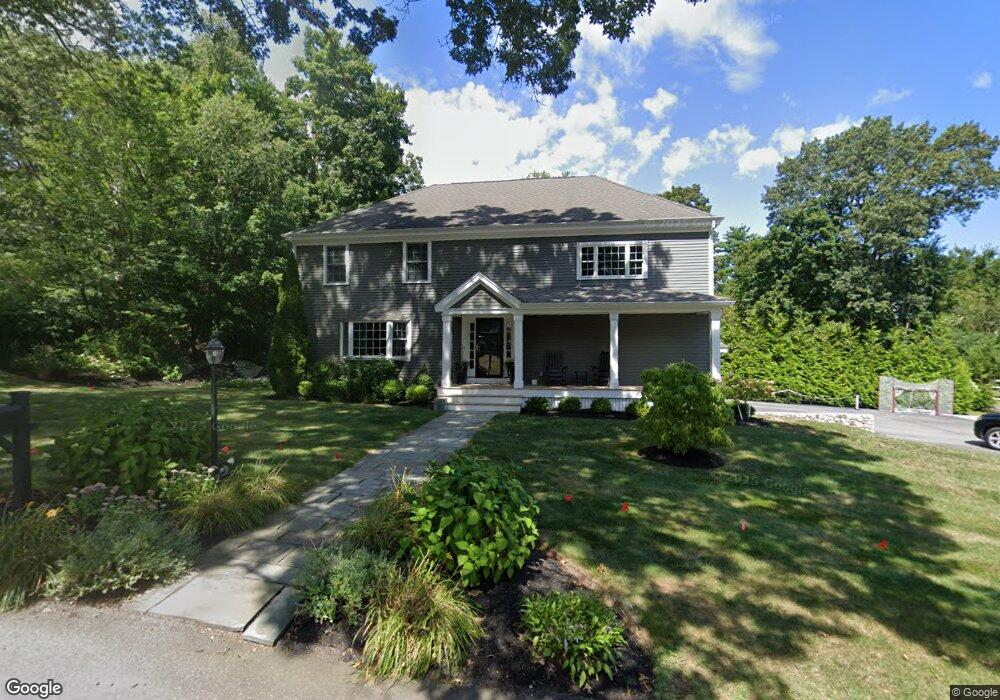
11 Towerbrook Rd Hingham, MA 02043
Estimated Value: $1,129,000 - $2,074,000
3
Beds
3
Baths
2,760
Sq Ft
$536/Sq Ft
Est. Value
About This Home
This home is located at 11 Towerbrook Rd, Hingham, MA 02043 and is currently estimated at $1,480,056, approximately $536 per square foot. 11 Towerbrook Rd is a home located in Plymouth County with nearby schools including Plymouth River Elementary School, Hingham Middle School, and Hingham High School.
Ownership History
Date
Name
Owned For
Owner Type
Purchase Details
Closed on
Apr 29, 2019
Sold by
Kelly John E and Kelly Jane C
Bought by
Aliperti James and Aliperti Erin
Current Estimated Value
Home Financials for this Owner
Home Financials are based on the most recent Mortgage that was taken out on this home.
Original Mortgage
$815,000
Outstanding Balance
$717,990
Interest Rate
4.3%
Mortgage Type
Purchase Money Mortgage
Estimated Equity
$762,066
Purchase Details
Closed on
Feb 15, 2002
Sold by
Kelly John E and Kelly Joan F
Bought by
Kelly Ii John E and Kelly Jane C
Create a Home Valuation Report for This Property
The Home Valuation Report is an in-depth analysis detailing your home's value as well as a comparison with similar homes in the area
Purchase History
| Date | Buyer | Sale Price | Title Company |
|---|---|---|---|
| Aliperti James | $1,115,000 | -- | |
| Kelly Ii John E | $190,000 | -- |
Source: Public Records
Mortgage History
| Date | Status | Borrower | Loan Amount |
|---|---|---|---|
| Open | Aliperti James | $815,000 | |
| Previous Owner | Kelly Ii John E | $133,000 | |
| Previous Owner | Kelly Ii John E | $275,000 | |
| Previous Owner | Kelly Ii John E | $20,000 |
Source: Public Records
Tax History
| Year | Tax Paid | Tax Assessment Tax Assessment Total Assessment is a certain percentage of the fair market value that is determined by local assessors to be the total taxable value of land and additions on the property. | Land | Improvement |
|---|---|---|---|---|
| 2025 | $12,396 | $1,159,600 | $413,800 | $745,800 |
| 2024 | $11,869 | $1,093,900 | $413,800 | $680,100 |
| 2023 | $10,561 | $1,056,100 | $413,800 | $642,300 |
| 2022 | $10,055 | $869,800 | $357,000 | $512,800 |
| 2021 | $9,786 | $829,300 | $357,000 | $472,300 |
| 2020 | $9,216 | $799,300 | $357,000 | $442,300 |
| 2019 | $9,101 | $770,600 | $357,000 | $413,600 |
| 2018 | $9,070 | $770,600 | $357,000 | $413,600 |
| 2017 | $8,552 | $698,100 | $344,800 | $353,300 |
| 2016 | $8,885 | $711,400 | $270,400 | $441,000 |
| 2015 | $8,522 | $680,100 | $239,100 | $441,000 |
Source: Public Records
Map
Nearby Homes
- 13 Towerbrook Rd
- 9 Towerbrook Rd
- 27 Myers Farm Rd
- 15 Towerbrook Rd
- 12 Towerbrook Rd
- 15 Tower Brook Rd
- 16 Tower Brook Rd
- 25 Myers Farm Rd
- 14 Towerbrook Rd
- 16 Towerbrook Rd
- 29 Myers Farm Rd
- 19 Towerbrook Rd
- 3 Butternut Ln
- 26 Myers Farm Rd
- 19 Tower Brook Rd
- 21 Myers Farm Rd
- 18 Towerbrook Rd
- 30 Myers Farm Rd
- 16 Woodbridge Rd
- 22 Myers Farm Rd
Your Personal Tour Guide
Ask me questions while you tour the home.