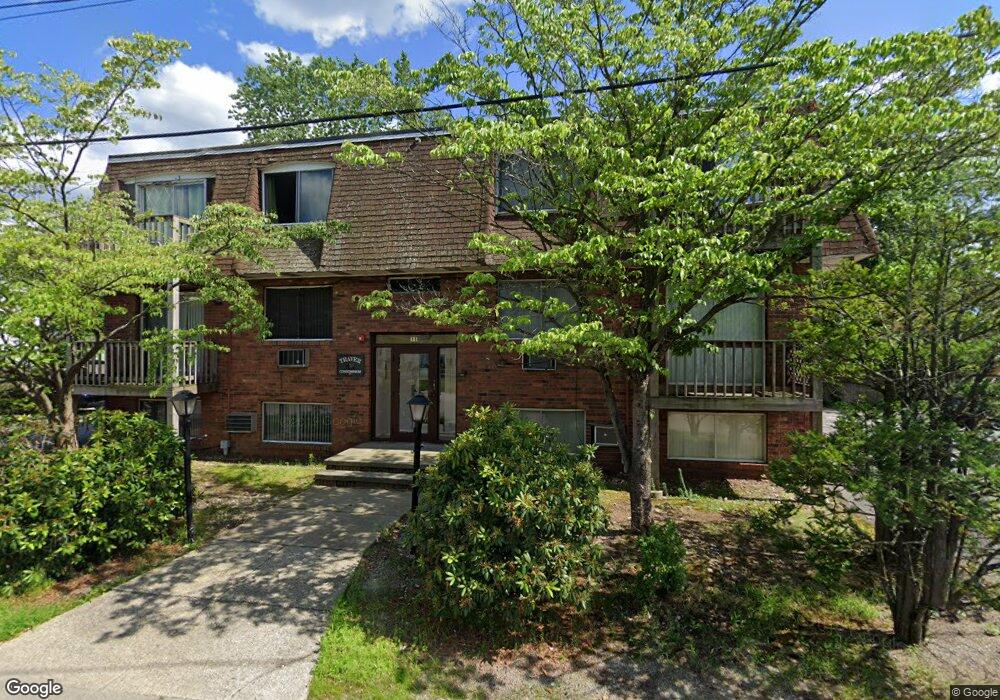
11 Traver Ave Unit 2 Johnston, RI 02919
Killingly Street NeighborhoodEstimated Value: $171,000 - $262,000
1
Bed
1
Bath
580
Sq Ft
$344/Sq Ft
Est. Value
About This Home
This home is located at 11 Traver Ave Unit 2, Johnston, RI 02919 and is currently estimated at $199,664, approximately $344 per square foot. 11 Traver Ave Unit 2 is a home located in Providence County with nearby schools including Johnston Senior High School, Achievement First Promesa, and Achievement First Providence Mayoral Academy Elementary.
Ownership History
Date
Name
Owned For
Owner Type
Purchase Details
Closed on
Jun 30, 2006
Sold by
Johnston Phillip G
Bought by
Debarros Edith
Current Estimated Value
Home Financials for this Owner
Home Financials are based on the most recent Mortgage that was taken out on this home.
Original Mortgage
$112,977
Outstanding Balance
$66,812
Interest Rate
6.58%
Mortgage Type
Purchase Money Mortgage
Estimated Equity
$132,852
Purchase Details
Closed on
May 12, 2006
Sold by
Malloy Tracy J
Bought by
Johnston Philip G
Home Financials for this Owner
Home Financials are based on the most recent Mortgage that was taken out on this home.
Original Mortgage
$112,977
Outstanding Balance
$66,812
Interest Rate
6.58%
Mortgage Type
Purchase Money Mortgage
Estimated Equity
$132,852
Create a Home Valuation Report for This Property
The Home Valuation Report is an in-depth analysis detailing your home's value as well as a comparison with similar homes in the area
Home Values in the Area
Average Home Value in this Area
Purchase History
| Date | Buyer | Sale Price | Title Company |
|---|---|---|---|
| Debarros Edith | $110,000 | -- | |
| Johnston Philip G | $55,000 | -- |
Source: Public Records
Mortgage History
| Date | Status | Borrower | Loan Amount |
|---|---|---|---|
| Open | Johnston Philip G | $112,977 | |
| Previous Owner | Johnston Philip G | $60,000 |
Source: Public Records
Tax History Compared to Growth
Tax History
| Year | Tax Paid | Tax Assessment Tax Assessment Total Assessment is a certain percentage of the fair market value that is determined by local assessors to be the total taxable value of land and additions on the property. | Land | Improvement |
|---|---|---|---|---|
| 2025 | $1,820 | $116,500 | $0 | $116,500 |
| 2024 | $1,782 | $116,500 | $0 | $116,500 |
| 2023 | $1,782 | $116,500 | $0 | $116,500 |
| 2022 | $1,318 | $56,700 | $0 | $56,700 |
| 2021 | $1,318 | $56,700 | $0 | $56,700 |
| 2018 | $1,168 | $42,500 | $0 | $42,500 |
| 2016 | $1,546 | $42,500 | $0 | $42,500 |
| 2015 | $1,513 | $52,200 | $0 | $52,200 |
| 2014 | $1,501 | $52,200 | $0 | $52,200 |
| 2013 | $1,501 | $52,200 | $0 | $52,200 |
Source: Public Records
Map
Nearby Homes
- 4 Day St
- 6 Day St
- 16 Homestead Ave
- 35 Hedley Ave
- 690 Killingly St
- 40 Cedar St
- 31 Devereux Ave Unit 305
- 25 Devereux St Unit 205
- 71 Waveland St
- 35 Auburn Ave
- 46 Auburn Ave
- 16 Clinton St
- 41 Fruit Hill Ave
- 32 Waterman Ave
- 0 Jackson Ave
- 11 Springfield Ave
- 17 Woonasquatucket Ave
- 0 Baltimore St
- 5 Case Ln
- 50 Rosemont Ave