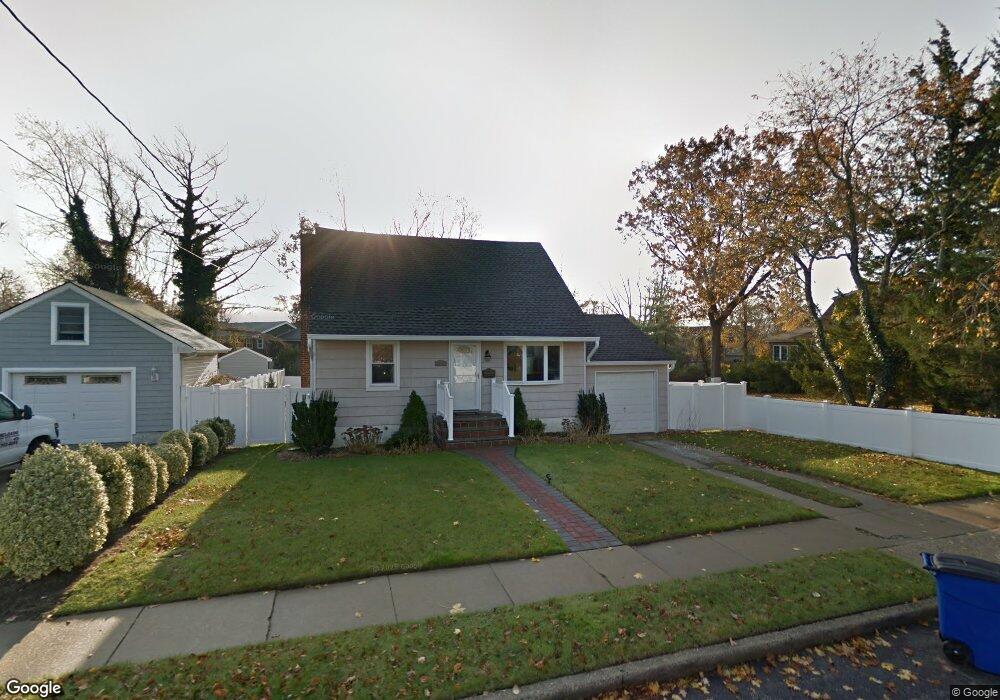
11 Triangle Place Freeport, NY 11520
Estimated Value: $610,597 - $655,000
Studio
2
Baths
1,092
Sq Ft
$579/Sq Ft
Est. Value
About This Home
This home is located at 11 Triangle Place, Freeport, NY 11520 and is currently estimated at $632,799, approximately $579 per square foot. 11 Triangle Place is a home located in Nassau County with nearby schools including Caroline G. Atkinson Intermediate School, Columbus Avenue School, and John W Dodd Middle School.
Ownership History
Date
Name
Owned For
Owner Type
Purchase Details
Closed on
Jul 2, 2009
Sold by
Einhorn Steven
Bought by
Jean-Louis Kimalee S and Jean-Louis Carl R
Current Estimated Value
Home Financials for this Owner
Home Financials are based on the most recent Mortgage that was taken out on this home.
Original Mortgage
$294,566
Outstanding Balance
$192,253
Interest Rate
5.31%
Mortgage Type
Purchase Money Mortgage
Estimated Equity
$440,546
Purchase Details
Closed on
Aug 21, 2008
Sold by
Us Bank National Association Series 2006
Bought by
Einhorn Steven
Purchase Details
Closed on
Jan 28, 2008
Sold by
Referee Of Nassau County
Bought by
Us Bank National Association Series 2006
Purchase Details
Closed on
Sep 14, 2005
Sold by
Safina Christopher
Bought by
Duran Ana
Purchase Details
Closed on
Aug 8, 2002
Sold by
Safina Christopher
Purchase Details
Closed on
Apr 21, 1999
Sold by
Smith Mary Jo
Bought by
Safina Christopher
Create a Home Valuation Report for This Property
The Home Valuation Report is an in-depth analysis detailing your home's value as well as a comparison with similar homes in the area
Home Values in the Area
Average Home Value in this Area
Purchase History
| Date | Buyer | Sale Price | Title Company |
|---|---|---|---|
| Jean-Louis Kimalee S | $300,000 | -- | |
| Einhorn Steven | $235,000 | None Available | |
| Us Bank National Association Series 2006 | $356,137 | Attorney | |
| Duran Ana | $420,000 | -- | |
| -- | -- | -- | |
| Safina Christopher | $157,000 | -- |
Source: Public Records
Mortgage History
| Date | Status | Borrower | Loan Amount |
|---|---|---|---|
| Open | Jean-Louis Kimalee S | $294,566 |
Source: Public Records
Tax History
| Year | Tax Paid | Tax Assessment Tax Assessment Total Assessment is a certain percentage of the fair market value that is determined by local assessors to be the total taxable value of land and additions on the property. | Land | Improvement |
|---|---|---|---|---|
| 2025 | $6,478 | $342 | $141 | $201 |
| 2024 | $699 | $333 | $137 | $196 |
Source: Public Records
Map
Nearby Homes
- 230 Park Ave
- 254 Park Ave
- 268 Locust Ave
- 306 Park Ave
- 172 Juanita Ave
- 311 Park Ave
- 156 Juanita Ave
- 2676 Johnson Place Unit 2674
- 2483 Central Ave
- 2864 Eastern Blvd
- 135 Whaley St
- 250 W Merrick Rd Unit 2R
- 250 W Merrick Rd Unit 2 L
- 250 W Merrick Rd Unit 2F
- 403 S Bayview Ave
- 525 Ray St
- 235 Pine St
- 2632 Central Ave
- 48 Saint Marks Ave
- 116 Westend Ave Unit 8
- 473 Sigmond St
- 19 Triangle Place
- 461 Sigmond St
- 461 Sigmond St Unit 1st Fl
- 483 Sigmond St
- 344 Rose St
- 344 Rose St
- 344 Rose St
- 338 Rose St
- 459 Sigmond St
- 235 Juanita Ave
- 231 Juanita Ave
- 474 Sigmond St
- 218 Moody Ave
- 237 Juanita Ave
- 31 Triangle Place
- 493 Sigmond St
- 457 Sigmond St
- 200 Park Ave
- 60 Moody Ave
Your Personal Tour Guide
Ask me questions while you tour the home.