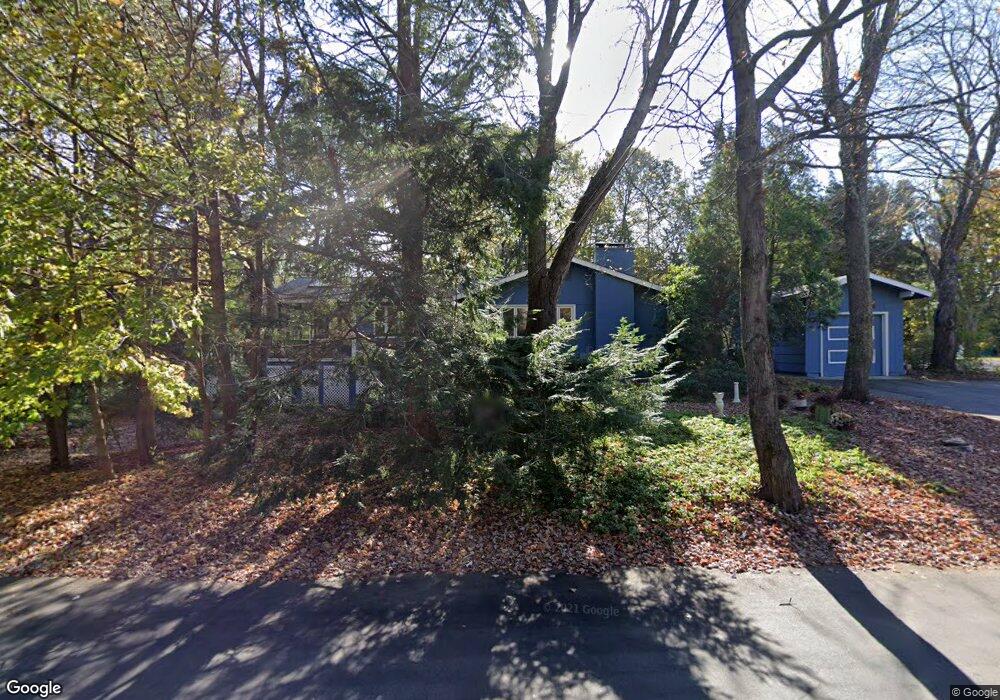
11 Tyler Rd Lexington, MA 02420
Countryside NeighborhoodEstimated Value: $1,352,000 - $1,802,000
3
Beds
2
Baths
1,648
Sq Ft
$923/Sq Ft
Est. Value
About This Home
This home is located at 11 Tyler Rd, Lexington, MA 02420 and is currently estimated at $1,521,682, approximately $923 per square foot. 11 Tyler Rd is a home located in Middlesex County with nearby schools including Harrington Elementary School, Jonas Clarke Middle School, and Lexington High School.
Ownership History
Date
Name
Owned For
Owner Type
Purchase Details
Closed on
Jun 3, 2010
Sold by
Wolf Roberta Lois
Bought by
Wolf Linda B and Wolf Thomas E
Current Estimated Value
Purchase Details
Closed on
Sep 11, 1984
Bought by
Wolf Linda B and Wolf Thomas E
Create a Home Valuation Report for This Property
The Home Valuation Report is an in-depth analysis detailing your home's value as well as a comparison with similar homes in the area
Home Values in the Area
Average Home Value in this Area
Purchase History
| Date | Buyer | Sale Price | Title Company |
|---|---|---|---|
| Wolf Linda B | -- | -- | |
| Wolf Linda B | -- | -- |
Source: Public Records
Mortgage History
| Date | Status | Borrower | Loan Amount |
|---|---|---|---|
| Previous Owner | Wolf Linda B | $88,000 | |
| Previous Owner | Wolf Linda B | $40,000 |
Source: Public Records
Tax History Compared to Growth
Tax History
| Year | Tax Paid | Tax Assessment Tax Assessment Total Assessment is a certain percentage of the fair market value that is determined by local assessors to be the total taxable value of land and additions on the property. | Land | Improvement |
|---|---|---|---|---|
| 2025 | $14,774 | $1,208,000 | $800,000 | $408,000 |
| 2024 | $14,467 | $1,181,000 | $762,000 | $419,000 |
| 2023 | $14,521 | $1,117,000 | $692,000 | $425,000 |
| 2022 | $13,772 | $998,000 | $629,000 | $369,000 |
| 2021 | $13,469 | $936,000 | $599,000 | $337,000 |
| 2020 | $12,926 | $920,000 | $599,000 | $321,000 |
| 2019 | $5,249 | $861,000 | $571,000 | $290,000 |
| 2018 | $11,980 | $814,000 | $543,000 | $271,000 |
| 2017 | $10,911 | $753,000 | $518,000 | $235,000 |
| 2016 | $10,395 | $712,000 | $493,000 | $219,000 |
| 2015 | $9,674 | $651,000 | $448,000 | $203,000 |
| 2014 | $8,996 | $580,000 | $407,000 | $173,000 |
Source: Public Records
Map
Nearby Homes
- 8 Blueberry Ln
- 22 Tyler Rd
- 15 Peachtree Rd
- 218 Lowell St
- 500 Lexington St Unit 6
- 19 Gershon Way Unit 1
- 19 Gershon Way
- 21 Derby Dr Unit 21
- 14 Nassau Dr
- 22 Bryant Rd
- 7 Whipple Rd
- 30 Whipple Rd
- 26 Berkshire Dr
- 276 High St
- 197 Woburn St
- 41 Squire Rd
- 257 High St
- 5 Carnegie Place
- 71 Webb St
- 7 Thornberry Rd