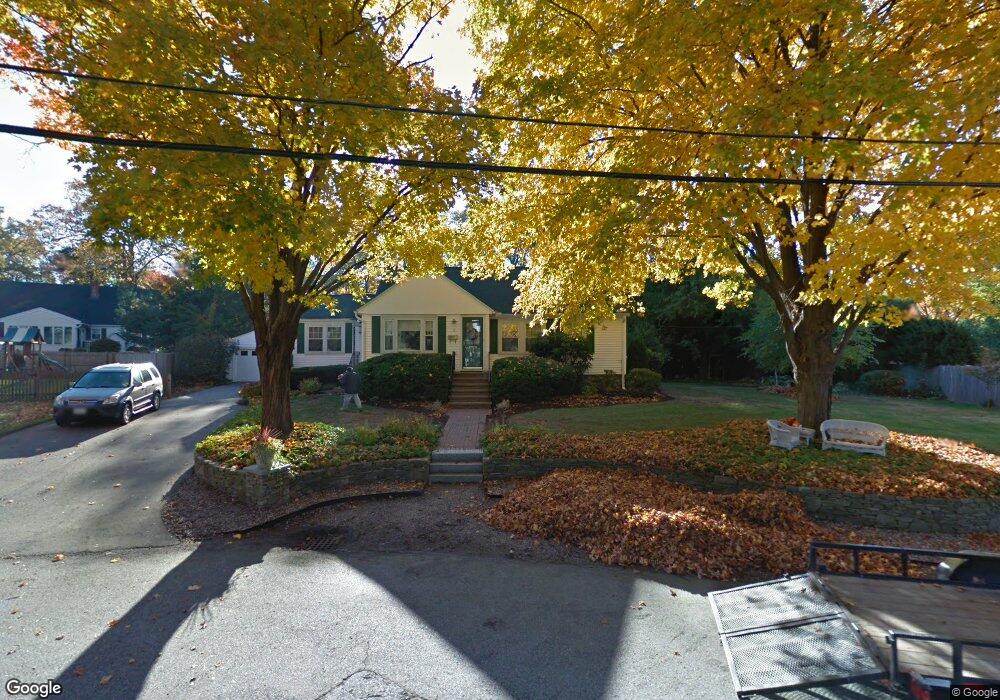
11 Tyler Rd North Andover, MA 01845
Estimated Value: $808,108 - $882,000
3
Beds
3
Baths
2,987
Sq Ft
$281/Sq Ft
Est. Value
About This Home
This home is located at 11 Tyler Rd, North Andover, MA 01845 and is currently estimated at $838,277, approximately $280 per square foot. 11 Tyler Rd is a home located in Essex County with nearby schools including Atkinson Elementary School, North Andover Middle School, and North Andover High School.
Ownership History
Date
Name
Owned For
Owner Type
Purchase Details
Closed on
Nov 10, 2004
Sold by
Eichler Janet
Bought by
Janet L Eichler Ret
Current Estimated Value
Purchase Details
Closed on
Aug 18, 1995
Sold by
Pinnola John J
Bought by
Eichler Janet
Home Financials for this Owner
Home Financials are based on the most recent Mortgage that was taken out on this home.
Original Mortgage
$70,000
Interest Rate
7.61%
Mortgage Type
Purchase Money Mortgage
Purchase Details
Closed on
May 31, 1994
Sold by
Curcio Mary C
Bought by
Pinnola John J
Home Financials for this Owner
Home Financials are based on the most recent Mortgage that was taken out on this home.
Original Mortgage
$157,400
Interest Rate
8.22%
Mortgage Type
Purchase Money Mortgage
Create a Home Valuation Report for This Property
The Home Valuation Report is an in-depth analysis detailing your home's value as well as a comparison with similar homes in the area
Home Values in the Area
Average Home Value in this Area
Purchase History
| Date | Buyer | Sale Price | Title Company |
|---|---|---|---|
| Janet L Eichler Ret | -- | -- | |
| Eichler Janet | $199,000 | -- | |
| Pinnola John J | $174,900 | -- |
Source: Public Records
Mortgage History
| Date | Status | Borrower | Loan Amount |
|---|---|---|---|
| Previous Owner | Pinnola John J | $53,000 | |
| Previous Owner | Pinnola John J | $70,000 | |
| Previous Owner | Pinnola John J | $147,175 | |
| Previous Owner | Pinnola John J | $157,400 |
Source: Public Records
Tax History Compared to Growth
Tax History
| Year | Tax Paid | Tax Assessment Tax Assessment Total Assessment is a certain percentage of the fair market value that is determined by local assessors to be the total taxable value of land and additions on the property. | Land | Improvement |
|---|---|---|---|---|
| 2025 | $8,014 | $711,700 | $342,700 | $369,000 |
| 2024 | $7,810 | $704,200 | $324,600 | $379,600 |
| 2023 | $7,343 | $599,900 | $274,100 | $325,800 |
| 2022 | $7,201 | $532,200 | $248,900 | $283,300 |
| 2021 | $7,191 | $507,500 | $225,400 | $282,100 |
| 2020 | $6,829 | $497,000 | $225,400 | $271,600 |
| 2019 | $6,665 | $497,000 | $225,400 | $271,600 |
| 2018 | $7,221 | $497,000 | $225,400 | $271,600 |
| 2017 | $5,208 | $364,700 | $187,100 | $177,600 |
| 2016 | $5,173 | $362,500 | $186,000 | $176,500 |
| 2015 | $4,944 | $343,600 | $178,900 | $164,700 |
Source: Public Records
Map
Nearby Homes
- 168 Greene St
- 11 W Bradstreet Rd
- 387 Massachusetts Ave
- 33 Herrick Rd
- 90 Edgelawn Ave Unit 1
- 19 Fernview Ave Unit 6
- 19 Fernview Ave Unit 5
- 35 Fernview Ave Unit 5
- 25 Fernview Ave Unit 8
- 23 Fernview Ave Unit 1
- 52 Fernview Ave Unit 7
- 75 Edgelawn Ave Unit 1
- 40 Fernview Ave Unit 11
- 64 2nd St
- 16 Court St
- 57 Glenwood St
- 127 Marblehead St Unit A
- 70 Farrwood Ave Unit 7
- 68 Union St
- 180 Chickering Rd Unit 310C