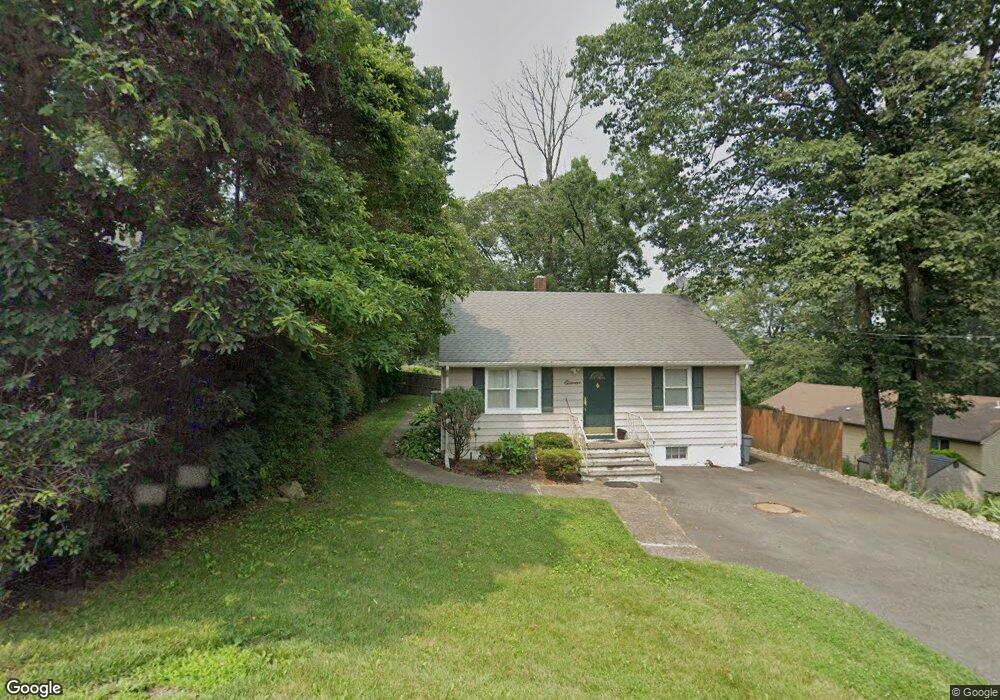
11 Unger Ave Stanhope, NJ 07874
Estimated Value: $297,448 - $387,000
2
Beds
1
Bath
808
Sq Ft
$419/Sq Ft
Est. Value
About This Home
This home is located at 11 Unger Ave, Stanhope, NJ 07874 and is currently estimated at $338,862, approximately $419 per square foot. 11 Unger Ave is a home located in Sussex County with nearby schools including Durban Avenue Elementary School, Hudson Maxim Elementary School, and Tulsa Trail Elementary School.
Ownership History
Date
Name
Owned For
Owner Type
Purchase Details
Closed on
Jun 13, 2003
Sold by
Salomon Robert and Salomon Betty Jo
Bought by
Sanni Hakeem and Sanni Ayotunde
Current Estimated Value
Home Financials for this Owner
Home Financials are based on the most recent Mortgage that was taken out on this home.
Original Mortgage
$188,510
Outstanding Balance
$80,657
Interest Rate
5.46%
Mortgage Type
FHA
Estimated Equity
$258,205
Create a Home Valuation Report for This Property
The Home Valuation Report is an in-depth analysis detailing your home's value as well as a comparison with similar homes in the area
Home Values in the Area
Average Home Value in this Area
Purchase History
| Date | Buyer | Sale Price | Title Company |
|---|---|---|---|
| Sanni Hakeem | $190,000 | Fidelity National Title Ins |
Source: Public Records
Mortgage History
| Date | Status | Borrower | Loan Amount |
|---|---|---|---|
| Open | Sanni Hakeem | $188,510 |
Source: Public Records
Tax History
| Year | Tax Paid | Tax Assessment Tax Assessment Total Assessment is a certain percentage of the fair market value that is determined by local assessors to be the total taxable value of land and additions on the property. | Land | Improvement |
|---|---|---|---|---|
| 2025 | $4,353 | $208,800 | $103,600 | $105,200 |
| 2024 | $4,857 | $208,800 | $103,600 | $105,200 |
Source: Public Records
Map
Nearby Homes
- 6 Flora Ave
- 5 Flora Ave
- 11 Wills Ave
- 49 Frances Ave
- 3 Canfield St
- 36 Ruth St
- 322 Flora Ave
- 35 Brendona Ave
- 0 Swayze Pl Lawrence Ave
- 0 Lawrence Ave
- 117 Brendona Ave
- 1 Smith St
- 305 Kingsland Rd
- 4 Woods Ave
- 8 Hillside Ave
- 7 Walton Place
- 55 Lakeside Blvd
- 2 Roberts Place
- 38 Silver Springs Dr
- 206 Brooklyn Mountain Rd
Your Personal Tour Guide
Ask me questions while you tour the home.