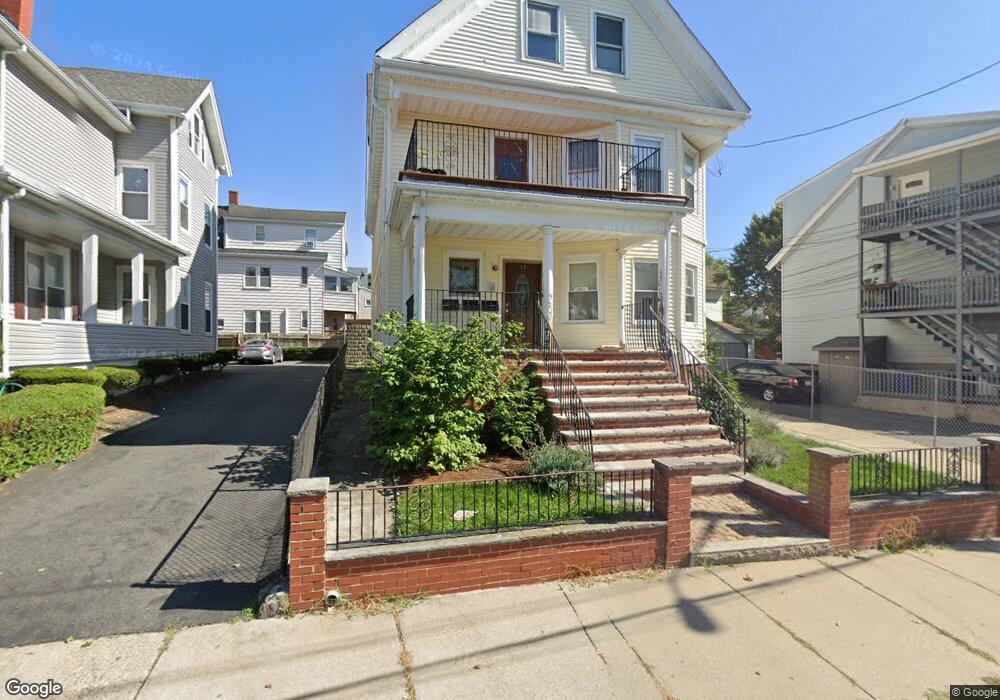
11 Upham St Malden, MA 02148
Suffolk Square NeighborhoodEstimated Value: $929,029 - $1,194,000
5
Beds
3
Baths
3,286
Sq Ft
$326/Sq Ft
Est. Value
About This Home
This home is located at 11 Upham St, Malden, MA 02148 and is currently estimated at $1,072,257, approximately $326 per square foot. 11 Upham St is a home located in Middlesex County with nearby schools including Malden High School, Cheverus Catholic School, and Malden Catholic.
Ownership History
Date
Name
Owned For
Owner Type
Purchase Details
Closed on
Mar 15, 2024
Sold by
Jourdan Phara and Jourdan Glodine
Bought by
Glose Eloi Jourdan Lt and Taylor
Current Estimated Value
Purchase Details
Closed on
Sep 21, 2023
Sold by
Jourdan Phara and Anderson Glodine
Bought by
Jourdan Phara and Jourdan Billine
Purchase Details
Closed on
May 28, 2020
Sold by
Jourdan Glose E
Bought by
Jourdan Phara and Jourdan Glodine
Purchase Details
Closed on
Mar 4, 2013
Sold by
Jepsen Ft and Jepsen
Bought by
Upham Int and Upham Jepsen
Home Financials for this Owner
Home Financials are based on the most recent Mortgage that was taken out on this home.
Original Mortgage
$120,000
Interest Rate
3.43%
Mortgage Type
New Conventional
Purchase Details
Closed on
Jan 3, 2000
Sold by
Oneill James J and Oneill Theresa M
Bought by
Jourdan Christian and Eloi-Jourdan Glose
Create a Home Valuation Report for This Property
The Home Valuation Report is an in-depth analysis detailing your home's value as well as a comparison with similar homes in the area
Home Values in the Area
Average Home Value in this Area
Purchase History
| Date | Buyer | Sale Price | Title Company |
|---|---|---|---|
| Glose Eloi Jourdan Lt | -- | None Available | |
| Glose Eloi Jourdan Lt | -- | None Available | |
| Jourdan Phara | -- | None Available | |
| Jourdan Phara | -- | None Available | |
| Jourdan Phara | -- | None Available | |
| Jourdan Phara | -- | None Available | |
| Upham Int | $160,000 | -- | |
| Upham Int | $160,000 | -- | |
| Jourdan Christian | $273,500 | -- |
Source: Public Records
Mortgage History
| Date | Status | Borrower | Loan Amount |
|---|---|---|---|
| Previous Owner | Upham Int | $120,000 | |
| Previous Owner | Jourdan Christian | $255,000 |
Source: Public Records
Tax History Compared to Growth
Tax History
| Year | Tax Paid | Tax Assessment Tax Assessment Total Assessment is a certain percentage of the fair market value that is determined by local assessors to be the total taxable value of land and additions on the property. | Land | Improvement |
|---|---|---|---|---|
| 2025 | $99 | $873,600 | $286,400 | $587,200 |
| 2024 | $9,619 | $822,800 | $270,500 | $552,300 |
| 2023 | $9,324 | $764,900 | $246,600 | $518,300 |
| 2022 | $8,949 | $724,600 | $222,800 | $501,800 |
| 2021 | $8,612 | $700,700 | $198,900 | $501,800 |
| 2020 | $8,352 | $660,200 | $192,100 | $468,100 |
| 2019 | $7,908 | $595,900 | $183,000 | $412,900 |
| 2018 | $7,627 | $541,300 | $151,200 | $390,100 |
| 2017 | $7,200 | $508,100 | $145,200 | $362,900 |
| 2016 | $6,628 | $437,200 | $133,300 | $303,900 |
| 2015 | $6,418 | $408,000 | $126,900 | $281,100 |
| 2014 | $6,055 | $376,100 | $115,400 | $260,700 |
Source: Public Records
Map
Nearby Homes
- 23 Upham St
- 13-15 Benner Ave
- 16 Boylston St
- 272-274 Cross St Unit 1A
- 272-274 Cross St Unit 3A
- 272-274 Cross St Unit 2B
- 272-274 Cross St Unit 3B
- 272-274 Cross St Unit 2A
- 23 Pratt St
- 17 Garland Ave
- 72 Ashland St Unit 307
- 44 Stevens St
- 17 Ashton St
- 89 Judson St
- 58 Almont St Unit 3
- 45 Richardson St
- 153A Belmont St
- 15-17 Barrett St
- 4 Cross St Unit 1
- 30 Franklin St Unit 105
- 11 Upham St Unit 2
- 11 Upham St Unit 3
- 11 Upham St Unit 1
- 22 Benner Ave Unit 24
- 22 Benner Ave Unit 1
- 24 Benner Ave Unit 2
- 17 Upham St
- 17 Upham St Unit 2
- 17 Upham St
- 17 Upham St Unit 1
- 19 Upham St Unit 1
- 19 Upham St
- 19 Upham St Unit 3
- 19 Upham St Unit 2
- 330 Ferry St
- 20 Benner Ave Unit 2
- 18 Benner Ave Unit 20
- 18-20 Benner Ave Unit 2
- 18-20 Benner Ave Unit 1
- 18 Benner Ave Unit 1