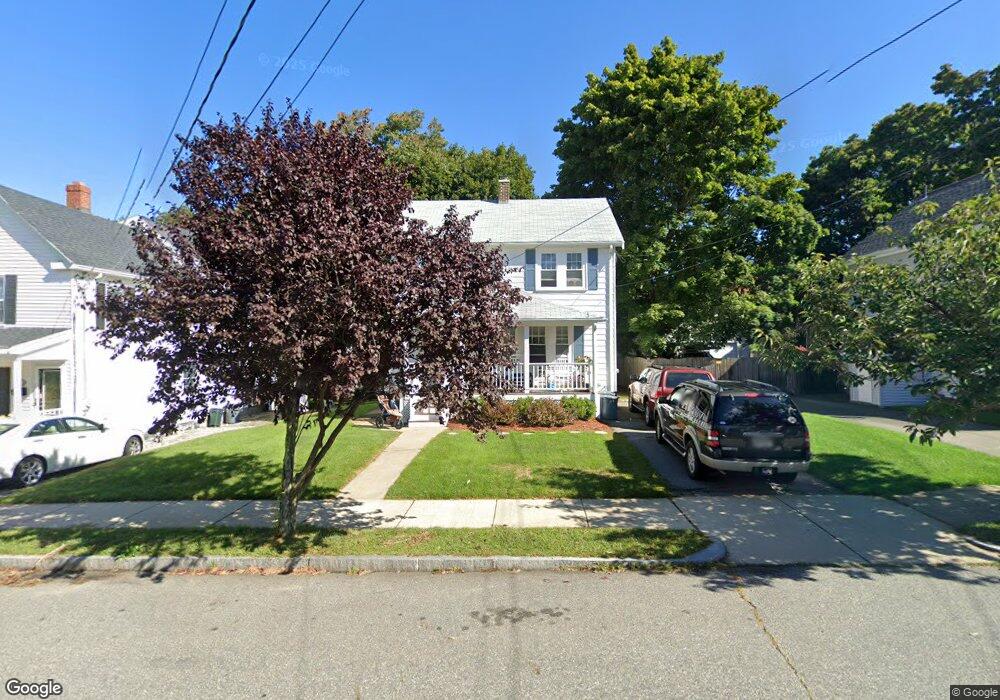
11 Utica St Woburn, MA 01801
Walnut Hill NeighborhoodEstimated Value: $673,000 - $807,000
3
Beds
1
Bath
1,248
Sq Ft
$585/Sq Ft
Est. Value
About This Home
This home is located at 11 Utica St, Woburn, MA 01801 and is currently estimated at $729,506, approximately $584 per square foot. 11 Utica St is a home located in Middlesex County with nearby schools including Goodyear Elementary School, John F. Kennedy Middle School, and Woburn High School.
Ownership History
Date
Name
Owned For
Owner Type
Purchase Details
Closed on
Mar 27, 2008
Sold by
Grande Roberta
Bought by
Bracey Patrice and Okeeffe Shaun
Current Estimated Value
Home Financials for this Owner
Home Financials are based on the most recent Mortgage that was taken out on this home.
Original Mortgage
$275,500
Outstanding Balance
$172,597
Interest Rate
5.76%
Mortgage Type
Purchase Money Mortgage
Estimated Equity
$556,909
Purchase Details
Closed on
Sep 21, 1988
Sold by
Santo Andrew J
Bought by
Grande Michael F
Home Financials for this Owner
Home Financials are based on the most recent Mortgage that was taken out on this home.
Original Mortgage
$124,000
Interest Rate
10.51%
Mortgage Type
Purchase Money Mortgage
Create a Home Valuation Report for This Property
The Home Valuation Report is an in-depth analysis detailing your home's value as well as a comparison with similar homes in the area
Home Values in the Area
Average Home Value in this Area
Purchase History
| Date | Buyer | Sale Price | Title Company |
|---|---|---|---|
| Bracey Patrice | $290,000 | -- | |
| Bracey Patrice | $290,000 | -- | |
| Grande Michael F | $155,000 | -- |
Source: Public Records
Mortgage History
| Date | Status | Borrower | Loan Amount |
|---|---|---|---|
| Open | Bracey Patrice | $275,500 | |
| Closed | Grande Michael F | $275,500 | |
| Previous Owner | Grande Michael F | $124,000 | |
| Previous Owner | Grande Michael F | $120,000 |
Source: Public Records
Tax History Compared to Growth
Tax History
| Year | Tax Paid | Tax Assessment Tax Assessment Total Assessment is a certain percentage of the fair market value that is determined by local assessors to be the total taxable value of land and additions on the property. | Land | Improvement |
|---|---|---|---|---|
| 2025 | $4,715 | $552,100 | $297,000 | $255,100 |
| 2024 | $4,244 | $526,500 | $282,900 | $243,600 |
| 2023 | $4,067 | $467,500 | $257,200 | $210,300 |
| 2022 | $3,885 | $416,000 | $223,600 | $192,400 |
| 2021 | $7,112 | $383,000 | $213,000 | $170,000 |
| 2020 | $5,432 | $381,900 | $213,000 | $168,900 |
| 2019 | $6,830 | $373,800 | $202,800 | $171,000 |
| 2018 | $3,368 | $340,500 | $186,100 | $154,400 |
| 2017 | $5,908 | $321,100 | $177,200 | $143,900 |
| 2016 | $3,040 | $302,500 | $165,600 | $136,900 |
| 2015 | $2,919 | $287,000 | $154,800 | $132,200 |
| 2014 | $2,885 | $276,300 | $154,800 | $121,500 |
Source: Public Records
Map
Nearby Homes
- 18 Central St
- 35 Grape St
- 6 Stratton Dr Unit 404
- 6 Stratton Dr Unit 410
- 18 Carmen Terrace
- 3 Frank St
- 2 Mason Way Unit 6524
- 6 Mason Way Unit 6324
- 2 Archer Dr Unit 1
- 19 Mason Way Unit 75
- 10 Mason Way Unit 61
- 2 Stratton Dr Unit 1109
- 200 Ledgewood Dr Unit 505
- 100 Ledgewood Dr Unit 417
- 100 Ledgewood Dr Unit 618
- 14 Grant Rd
- 3 Laurel St
- 295 Salem St Unit 69
- 405 William St
- 51 Vernon St
- 13 Utica St
- 9 Utica St
- 15 Utica St
- 5 Utica St
- 17 Utica St Unit 17
- 10 Utica St
- 8 Hawthorne St Unit A
- 8 Hawthorne St Unit 8
- 8 Utica St
- 110 Washington St
- 12 Hawthorne St Unit 12
- 12 Hawthorne St Unit A
- 14 Hawthorne St Unit 14
- 100 Washington St
- 100 Washington St Unit 5
- 26 Central St Unit 26
- 26 Central St Unit 2
- 26 Central St Unit 1
- 26 Central St
- 10 Hawthorne St Unit 10