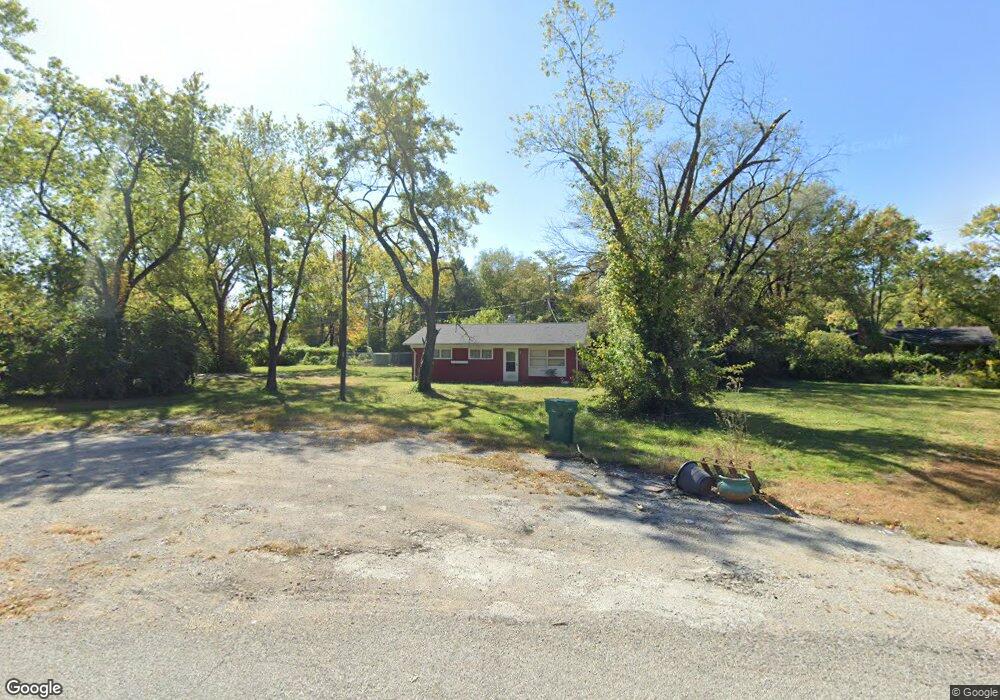
11 Violet Dr East Saint Louis, IL 62206
Estimated Value: $43,380 - $65,000
--
Bed
--
Bath
925
Sq Ft
$54/Sq Ft
Est. Value
About This Home
This home is located at 11 Violet Dr, East Saint Louis, IL 62206 and is currently estimated at $50,095, approximately $54 per square foot. 11 Violet Dr is a home located in St. Clair County.
Ownership History
Date
Name
Owned For
Owner Type
Purchase Details
Closed on
Sep 29, 2025
Sold by
Bustling Funding Llc
Bought by
1118 Enterprises Llc
Current Estimated Value
Purchase Details
Closed on
Mar 3, 2025
Sold by
Bustling Funding Llc
Bought by
Boback Saiidnia and Gt Ao Missouri Re Llc
Home Financials for this Owner
Home Financials are based on the most recent Mortgage that was taken out on this home.
Original Mortgage
$76,000
Interest Rate
11.26%
Mortgage Type
Commercial
Purchase Details
Closed on
Mar 19, 2024
Sold by
Bean Virginia and Woods Patricia
Bought by
Bustling Funding Llc
Purchase Details
Closed on
Apr 1, 1997
Bought by
Bean Virginia and Bean Bruce
Create a Home Valuation Report for This Property
The Home Valuation Report is an in-depth analysis detailing your home's value as well as a comparison with similar homes in the area
Home Values in the Area
Average Home Value in this Area
Purchase History
| Date | Buyer | Sale Price | Title Company |
|---|---|---|---|
| 1118 Enterprises Llc | $42,000 | Freedom Title | |
| Boback Saiidnia | $79,000 | None Available | |
| Bustling Funding Llc | $34,000 | Accent Title | |
| Bean Virginia | $7,700 | -- |
Source: Public Records
Mortgage History
| Date | Status | Borrower | Loan Amount |
|---|---|---|---|
| Previous Owner | Boback Saiidnia | $76,000 |
Source: Public Records
Tax History Compared to Growth
Tax History
| Year | Tax Paid | Tax Assessment Tax Assessment Total Assessment is a certain percentage of the fair market value that is determined by local assessors to be the total taxable value of land and additions on the property. | Land | Improvement |
|---|---|---|---|---|
| 2024 | $805 | $5,394 | $462 | $4,932 |
| 2023 | $722 | $4,876 | $418 | $4,458 |
| 2022 | $619 | $4,273 | $366 | $3,907 |
| 2021 | $642 | $4,049 | $347 | $3,702 |
| 2020 | $695 | $4,181 | $364 | $3,817 |
| 2019 | $721 | $4,181 | $364 | $3,817 |
| 2018 | $730 | $4,242 | $369 | $3,873 |
| 2017 | $691 | $4,139 | $360 | $3,779 |
| 2016 | $687 | $3,679 | $359 | $3,320 |
| 2014 | $562 | $3,639 | $355 | $3,284 |
| 2013 | $654 | $3,413 | $333 | $3,080 |
Source: Public Records
Map
Nearby Homes