Estimated Value: $312,000 - $574,000
--
Bed
--
Bath
3,009
Sq Ft
$155/Sq Ft
Est. Value
About This Home
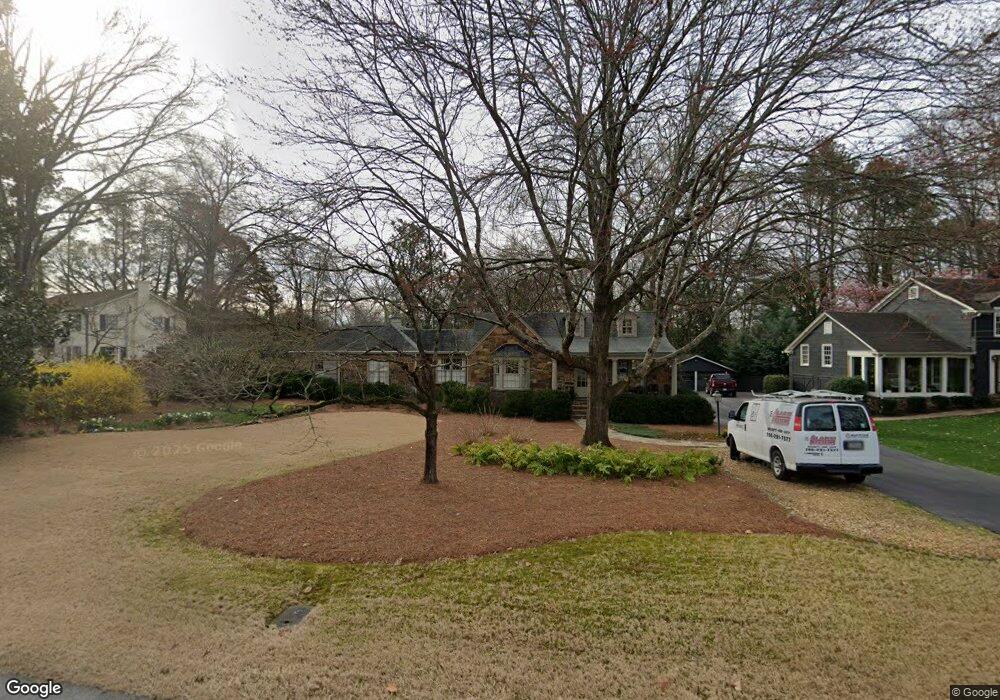
This home is located at 11 Virginia Cir SW, Rome, GA 30161 and is currently estimated at $467,004, approximately $155 per square foot. 11 Virginia Cir SW is a home located in Floyd County with nearby schools including Dan McCarty Middle School, Rome High School, and Darlington School.
Ownership History
Date
Name
Owned For
Owner Type
Purchase Details
Closed on
Mar 31, 2005
Bought by
P and R
Current Estimated Value
Purchase Details
Closed on
Jul 12, 2004
Sold by
Willingham Clara E P and Willingham R
Bought by
Keaten Helen H
Purchase Details
Closed on
Feb 19, 1997
Bought by
P and R
Purchase Details
Closed on
Jan 29, 1997
Sold by
Willingham Tom and Willingham Clara E
Bought by
Willingham Clara E P and Willingham R
Purchase Details
Closed on
Jun 20, 1985
Sold by
Saunders Claud H and Saunders Virginia T
Bought by
Willingham Tom and Willingham Clara E
Purchase Details
Closed on
Jun 17, 1980
Sold by
Saunders Claude
Bought by
Saunders Claud H and Saunders Virginia T
Purchase Details
Closed on
Sep 1, 1946
Bought by
P and R
Purchase Details
Closed on
Oct 3, 1941
Bought by
P and R
Purchase Details
Closed on
Jul 31, 1940
Bought by
Saunders Claude
Create a Home Valuation Report for This Property
The Home Valuation Report is an in-depth analysis detailing your home's value as well as a comparison with similar homes in the area
Home Values in the Area
Average Home Value in this Area
Purchase History
| Date | Buyer | Sale Price | Title Company |
|---|---|---|---|
| P | -- | -- | |
| Keaten Helen H | $235,000 | -- | |
| P | -- | -- | |
| Willingham Clara E P | -- | -- | |
| Willingham Tom | $90,000 | -- | |
| Saunders Claud H | $42,500 | -- | |
| P | -- | -- | |
| P | -- | -- | |
| Saunders Claude | -- | -- |
Source: Public Records
Tax History Compared to Growth
Tax History
| Year | Tax Paid | Tax Assessment Tax Assessment Total Assessment is a certain percentage of the fair market value that is determined by local assessors to be the total taxable value of land and additions on the property. | Land | Improvement |
|---|---|---|---|---|
| 2024 | $4,255 | $220,872 | $18,164 | $202,708 |
| 2023 | $5,405 | $218,535 | $16,146 | $202,389 |
| 2022 | $4,991 | $183,016 | $13,118 | $169,898 |
| 2021 | $4,781 | $166,908 | $13,118 | $153,790 |
| 2020 | $4,647 | $156,919 | $10,091 | $146,828 |
| 2019 | $4,472 | $149,773 | $10,091 | $139,682 |
| 2018 | $4,342 | $142,339 | $10,091 | $132,248 |
| 2017 | $4,275 | $138,433 | $10,091 | $128,342 |
| 2016 | $4,242 | $135,727 | $10,080 | $125,647 |
| 2015 | $3,951 | $135,727 | $10,080 | $125,647 |
| 2014 | $3,951 | $135,727 | $10,080 | $125,647 |
Source: Public Records
Map
Nearby Homes
- 101 Hardy Ave SW
- 204 Myrtle St SW
- 334 Branham Ave SW
- 218 Wilson Ave SW
- 105 Mary St SW
- 110 Cherokee St SW
- 232 S Broad St SW
- 410 Hardy Ave SW
- 6 Horseleg Creek Rd SW
- 3 Grover St SW
- 107 Butler St SW
- 18 Butler St SW
- 515 Harper Ave SW
- 1005 N 2nd Ave NW
- 1005 N 2nd Ave NW Unit 31
- 515 S Broad St SW
- 8 E 3rd Ave
- 10 E 3rd Ave
- 3 Porter St SW
- 9 Virginia Cir SW
- 13 Virginia Cir SW
- 8 Orlystes Dr SW
- 7 Virginia Cir SW
- 15 Virginia Cir SW Unit I14W201
- 15 Virginia Cir SW
- 13 Club Dr SW
- 6 Orlystes Dr SW
- 12 Orlystes Dr SW
- 5 Virginia Cir SW
- 0 Orlystes Dr SW Unit 8382317
- 0 Orlystes Dr SW Unit 8886244
- 0 Virginia Cir SW Unit 8455270
- 0 Virginia Cir SW Unit 8331543
- 0 Virginia Cir SW Unit 8179926
- 1 Club Dr SW
- 19 Virginia Cir SW
- 0 Club Dr Unit 3209157
- 0 Club Dr
- 4 Club Dr SW