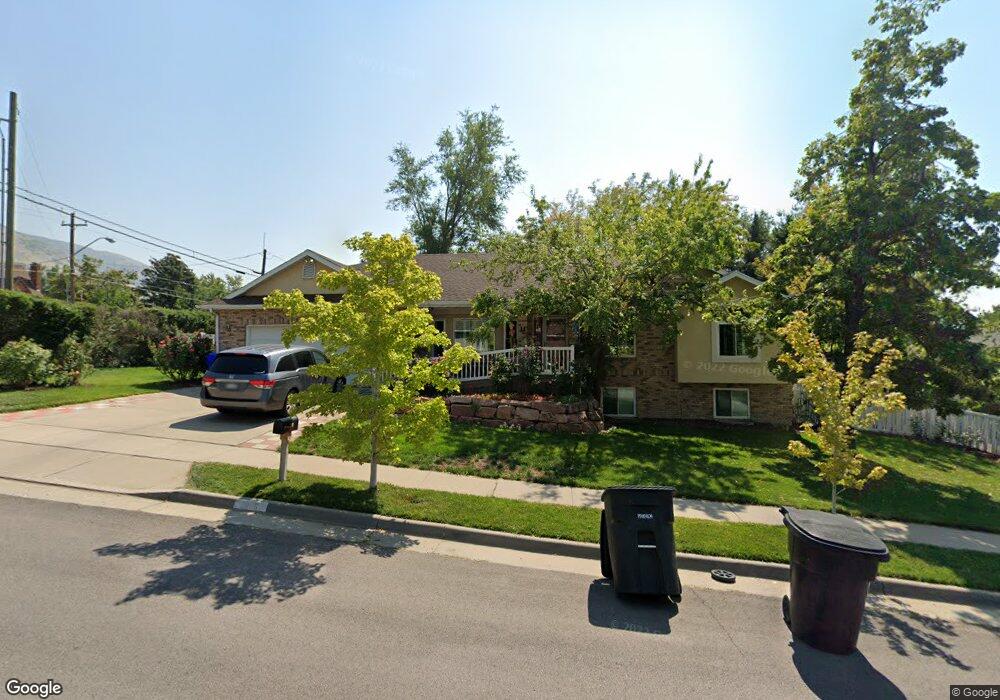
11 W 1350 N Centerville, UT 84014
Estimated Value: $617,000 - $745,000
--
Bed
4
Baths
1,539
Sq Ft
$433/Sq Ft
Est. Value
About This Home
This home is located at 11 W 1350 N, Centerville, UT 84014 and is currently estimated at $665,679, approximately $432 per square foot. 11 W 1350 N is a home located in Davis County with nearby schools including Stewart Elementary School, Centerville Jr High, and Viewmont High School.
Ownership History
Date
Name
Owned For
Owner Type
Purchase Details
Closed on
Apr 29, 2021
Sold by
Backes Douglas and Backes Michele L
Bought by
Backes Douglas and The Douglas And Michele Backes
Current Estimated Value
Home Financials for this Owner
Home Financials are based on the most recent Mortgage that was taken out on this home.
Original Mortgage
$207,750
Outstanding Balance
$156,247
Interest Rate
3.1%
Mortgage Type
New Conventional
Estimated Equity
$509,432
Purchase Details
Closed on
Dec 10, 2010
Sold by
Backes Douglas J and Backes Michele L
Bought by
Backes Michele L
Purchase Details
Closed on
Mar 14, 2005
Sold by
Cowley James L and Cowley Amy J
Bought by
Backer Douglas J and Backer Michele L
Home Financials for this Owner
Home Financials are based on the most recent Mortgage that was taken out on this home.
Original Mortgage
$210,000
Interest Rate
5.61%
Mortgage Type
New Conventional
Create a Home Valuation Report for This Property
The Home Valuation Report is an in-depth analysis detailing your home's value as well as a comparison with similar homes in the area
Home Values in the Area
Average Home Value in this Area
Purchase History
| Date | Buyer | Sale Price | Title Company |
|---|---|---|---|
| Backes Douglas | -- | Gateway Title Ins Age | |
| Backes Douglas | -- | Gateway Title Ins Ag | |
| Backes Michele L | -- | None Available | |
| Backer Douglas J | -- | None Available |
Source: Public Records
Mortgage History
| Date | Status | Borrower | Loan Amount |
|---|---|---|---|
| Open | Backes Douglas | $207,750 | |
| Closed | Backer Douglas J | $210,000 |
Source: Public Records
Tax History Compared to Growth
Tax History
| Year | Tax Paid | Tax Assessment Tax Assessment Total Assessment is a certain percentage of the fair market value that is determined by local assessors to be the total taxable value of land and additions on the property. | Land | Improvement |
|---|---|---|---|---|
| 2025 | $3,628 | $326,150 | $157,440 | $168,710 |
| 2024 | $3,448 | $316,800 | $142,053 | $174,747 |
| 2023 | $3,379 | $565,000 | $232,302 | $332,698 |
| 2022 | $3,506 | $324,500 | $117,444 | $207,056 |
| 2021 | $3,228 | $465,000 | $180,012 | $284,988 |
| 2020 | $2,862 | $411,000 | $175,461 | $235,539 |
| 2019 | $2,877 | $406,000 | $174,678 | $231,322 |
| 2018 | $2,685 | $375,000 | $162,020 | $212,980 |
| 2016 | $2,320 | $181,830 | $52,439 | $129,391 |
| 2015 | $2,305 | $171,160 | $52,439 | $118,721 |
| 2014 | $2,325 | $177,507 | $52,439 | $125,068 |
| 2013 | -- | $161,035 | $40,319 | $120,716 |
Source: Public Records
Map
Nearby Homes
- 1441 N Main St
- 1238 N 450 W
- 1285 Nola Dr
- 145 Ford Canyon Dr
- 271 Brookfield Ln
- 429 W 1050 N
- 775 Pheasantbrook Cir
- 67 W Pheasantbrook Dr
- 1154 N 700 W
- 732 W 1175 N
- 781 Pheasantbrook Dr
- 763 Pheasantbrook Dr
- 751 Pheasantbrook Dr
- 171 W 650 N
- 495 Creek View Rd
- 43 E 1825 N
- 1851 N Main St
- 281 W 650 N Unit C
- 509 Applewood Dr
- 447 W 620 N Unit 106