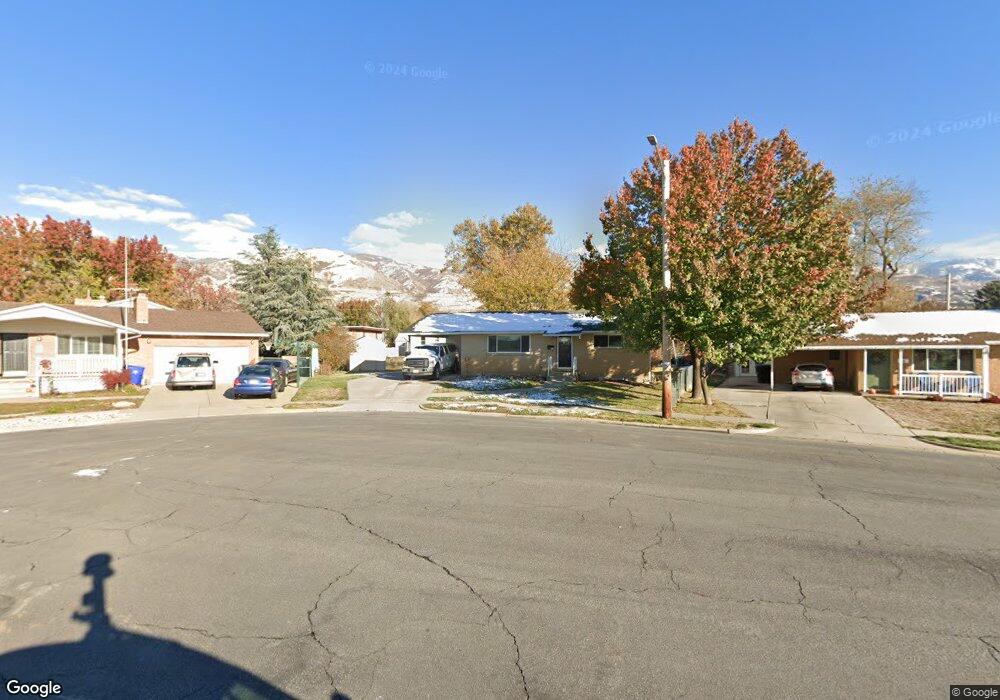
11 W 900 N Bountiful, UT 84010
Estimated Value: $446,000 - $524,000
2
Beds
2
Baths
999
Sq Ft
$472/Sq Ft
Est. Value
About This Home
This home is located at 11 W 900 N, Bountiful, UT 84010 and is currently estimated at $471,986, approximately $472 per square foot. 11 W 900 N is a home located in Davis County with nearby schools including Meadowbrook Elementary School, Bountiful Junior High School, and Viewmont High School.
Ownership History
Date
Name
Owned For
Owner Type
Purchase Details
Closed on
Nov 10, 2006
Sold by
Bishop B Grant
Bought by
Reed Steven P and Reed Melody
Current Estimated Value
Home Financials for this Owner
Home Financials are based on the most recent Mortgage that was taken out on this home.
Original Mortgage
$104,000
Outstanding Balance
$61,439
Interest Rate
6.28%
Mortgage Type
Purchase Money Mortgage
Estimated Equity
$410,547
Purchase Details
Closed on
Jan 17, 2003
Sold by
Bishop B Grant
Bought by
Bishop B Grant
Purchase Details
Closed on
Jan 16, 2003
Sold by
Bishop Nelda M
Bought by
Bishop B Grant
Purchase Details
Closed on
Jan 15, 2003
Sold by
Bishop B Grant
Bought by
Bishop B Grant
Purchase Details
Closed on
Mar 6, 2000
Sold by
Bishop Bruce Grant Lyman and Bishop Nelda M
Bought by
Bishop Nelda M and Restated Nelda M Bishop Inter Vivos Rece
Create a Home Valuation Report for This Property
The Home Valuation Report is an in-depth analysis detailing your home's value as well as a comparison with similar homes in the area
Purchase History
| Date | Buyer | Sale Price | Title Company |
|---|---|---|---|
| Reed Steven P | -- | United Title Svcs Of Utah | |
| Reed Steven P | -- | United Title Svcs Of Utah | |
| Bishop B Grant | -- | -- | |
| Bishop B Grant | -- | -- | |
| Bishop B Grant | -- | -- | |
| Bishop B Grant | -- | -- | |
| Bishop Nelda M | -- | -- | |
| Bishop B Grant | -- | -- |
Source: Public Records
Mortgage History
| Date | Status | Borrower | Loan Amount |
|---|---|---|---|
| Open | Reed Steven P | $104,000 |
Source: Public Records
Tax History
| Year | Tax Paid | Tax Assessment Tax Assessment Total Assessment is a certain percentage of the fair market value that is determined by local assessors to be the total taxable value of land and additions on the property. | Land | Improvement |
|---|---|---|---|---|
| 2025 | $2,618 | $233,750 | $140,494 | $93,256 |
| 2024 | $2,438 | $226,600 | $126,006 | $100,594 |
| 2023 | $2,347 | $396,000 | $231,422 | $164,578 |
| 2022 | $2,449 | $227,150 | $126,261 | $100,889 |
| 2021 | $2,280 | $324,000 | $165,259 | $158,741 |
| 2020 | $1,926 | $273,000 | $140,901 | $132,099 |
| 2019 | $1,949 | $270,000 | $146,998 | $123,002 |
| 2018 | $1,795 | $244,000 | $144,052 | $99,948 |
| 2016 | $1,529 | $112,365 | $60,295 | $52,070 |
| 2015 | $1,470 | $101,750 | $60,295 | $41,455 |
| 2014 | $1,523 | $109,149 | $60,295 | $48,854 |
| 2013 | -- | $103,289 | $39,809 | $63,480 |
Source: Public Records
Map
Nearby Homes
- 106 W 700 N
- 184 Park Shadows Cir
- 1130 N 200 W
- 1420 N Main St
- 563 N 200 W
- 499 N 200 W Unit 30
- 453 N 400 E Unit 7-D
- 235 W 1400 N
- 252 N Main St
- 256 N Main St
- 254 N Main St
- 41 E 200 N Unit 6
- 49 E 200 N Unit 4
- 55 E 200 N Unit 2
- 51 E 200 N Unit 3
- 320 N 200 W Unit 4
- 332 N 300 W
- 366 W 1000 N
- 345 N 400 E
- 96 Village Square Rd
Your Personal Tour Guide
Ask me questions while you tour the home.