Estimated Value: $338,000 - $352,000
2
Beds
1
Bath
253
Sq Ft
$1,367/Sq Ft
Est. Value
About This Home
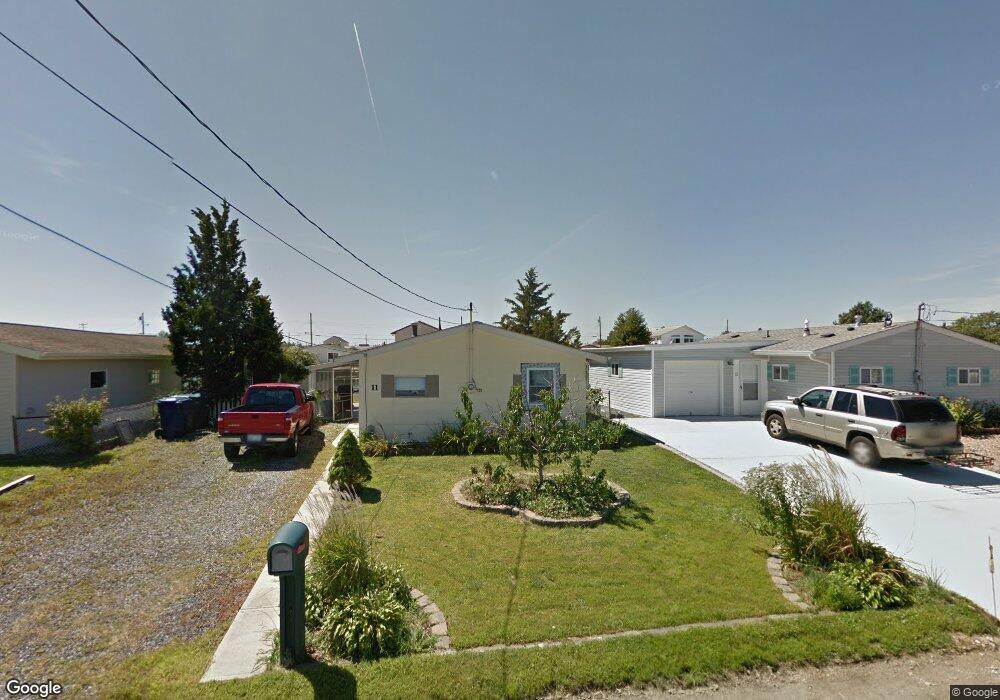
This home is located at 11 W Mohawk Dr, Little Egg Harbor Township, NJ 08087 and is currently estimated at $345,854, approximately $1,367 per square foot. 11 W Mohawk Dr is a home located in Ocean County with nearby schools including Frog Pond Elementary School, Pinelands Regional Junior High School, and Pinelands Regional High School.
Ownership History
Date
Name
Owned For
Owner Type
Purchase Details
Closed on
Aug 21, 2000
Sold by
Tighe Robert
Bought by
Tatro Charles
Current Estimated Value
Home Financials for this Owner
Home Financials are based on the most recent Mortgage that was taken out on this home.
Original Mortgage
$34,500
Outstanding Balance
$12,377
Interest Rate
8.07%
Estimated Equity
$333,477
Purchase Details
Closed on
May 24, 1994
Sold by
Stilwell Dorothy
Bought by
Tighe Robert and Tighe Janet
Home Financials for this Owner
Home Financials are based on the most recent Mortgage that was taken out on this home.
Original Mortgage
$50,000
Interest Rate
8.5%
Create a Home Valuation Report for This Property
The Home Valuation Report is an in-depth analysis detailing your home's value as well as a comparison with similar homes in the area
Home Values in the Area
Average Home Value in this Area
Purchase History
| Date | Buyer | Sale Price | Title Company |
|---|---|---|---|
| Tatro Charles | $84,500 | -- | |
| Tighe Robert | $56,000 | -- |
Source: Public Records
Mortgage History
| Date | Status | Borrower | Loan Amount |
|---|---|---|---|
| Open | Tatro Charles | $34,500 | |
| Previous Owner | Tighe Robert | $50,000 |
Source: Public Records
Tax History Compared to Growth
Tax History
| Year | Tax Paid | Tax Assessment Tax Assessment Total Assessment is a certain percentage of the fair market value that is determined by local assessors to be the total taxable value of land and additions on the property. | Land | Improvement |
|---|---|---|---|---|
| 2025 | $3,444 | $116,900 | $80,000 | $36,900 |
| 2024 | $3,302 | $116,900 | $80,000 | $36,900 |
| 2023 | $3,198 | $116,900 | $80,000 | $36,900 |
| 2022 | $3,198 | $116,900 | $80,000 | $36,900 |
| 2021 | $3,146 | $116,900 | $80,000 | $36,900 |
| 2020 | $3,089 | $116,900 | $80,000 | $36,900 |
| 2019 | $2,981 | $116,900 | $80,000 | $36,900 |
| 2018 | $2,813 | $116,900 | $80,000 | $36,900 |
| 2017 | $2,778 | $116,900 | $80,000 | $36,900 |
| 2016 | $2,795 | $116,900 | $80,000 | $36,900 |
| 2015 | $2,828 | $116,900 | $80,000 | $36,900 |
| 2014 | $4,010 | $209,600 | $150,000 | $59,600 |
Source: Public Records
Map
Nearby Homes
- 107 E Susquehanna Dr
- 113 E Delaware Dr
- 128 E Delaware Dr
- 42 W Mohawk Dr
- 26 W Mullica Rd
- 35 W Mullica Rd
- 11 W Thames Rd
- 48 W Potomac Dr
- 135 E Potomac Dr
- 107 E Shrewsbury Dr
- 99 Lake Superior Dr
- 44 S Portland Dr
- 20 W Navasink Dr
- 30 Lake Singleton Ct
- 32 Lake Singleton Ct
- 28 W Navasink Dr
- 32 W Navasink Dr
- 27 Lake Huron Dr
- 58 W Anchor Dr