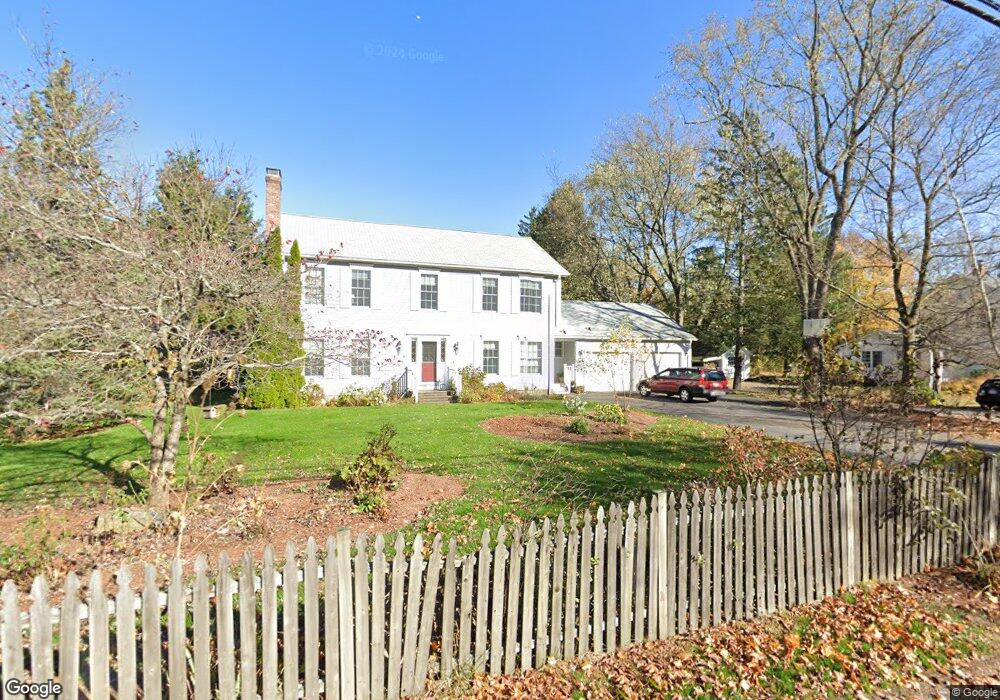
11 Walnut St Shrewsbury, MA 01545
Estimated Value: $760,000 - $929,000
4
Beds
3
Baths
2,713
Sq Ft
$303/Sq Ft
Est. Value
About This Home
This home is located at 11 Walnut St, Shrewsbury, MA 01545 and is currently estimated at $822,364, approximately $303 per square foot. 11 Walnut St is a home located in Worcester County with nearby schools including Floral Street School, Sherwood Middle School, and Oak Middle School.
Ownership History
Date
Name
Owned For
Owner Type
Purchase Details
Closed on
Jun 22, 1998
Sold by
Buma Frederick S and Buma Judith B
Bought by
Record Richard R
Current Estimated Value
Purchase Details
Closed on
Jul 6, 1993
Sold by
Putnam Margaret
Bought by
Lunt Steven and Lunt Therese M
Create a Home Valuation Report for This Property
The Home Valuation Report is an in-depth analysis detailing your home's value as well as a comparison with similar homes in the area
Home Values in the Area
Average Home Value in this Area
Purchase History
| Date | Buyer | Sale Price | Title Company |
|---|---|---|---|
| Record Richard R | $40,000 | -- | |
| Record Richard R | $40,000 | -- | |
| Lunt Steven | $187,000 | -- |
Source: Public Records
Mortgage History
| Date | Status | Borrower | Loan Amount |
|---|---|---|---|
| Open | Lunt Steven | $270,000 | |
| Closed | Lunt Steven | $204,000 |
Source: Public Records
Tax History
| Year | Tax Paid | Tax Assessment Tax Assessment Total Assessment is a certain percentage of the fair market value that is determined by local assessors to be the total taxable value of land and additions on the property. | Land | Improvement |
|---|---|---|---|---|
| 2025 | $94 | $782,200 | $269,000 | $513,200 |
| 2024 | $9,441 | $762,600 | $256,200 | $506,400 |
| 2023 | $8,818 | $672,100 | $256,200 | $415,900 |
| 2022 | $8,350 | $591,800 | $256,200 | $335,600 |
| 2021 | $6,813 | $516,500 | $205,000 | $311,500 |
| 2020 | $6,491 | $520,500 | $205,000 | $315,500 |
| 2019 | $6,169 | $490,800 | $189,200 | $301,600 |
| 2018 | $6,135 | $484,600 | $182,000 | $302,600 |
| 2017 | $5,879 | $458,200 | $165,600 | $292,600 |
| 2016 | $5,916 | $455,100 | $156,100 | $299,000 |
| 2015 | $5,850 | $443,200 | $151,400 | $291,800 |
Source: Public Records
Map
Nearby Homes
Your Personal Tour Guide
Ask me questions while you tour the home.