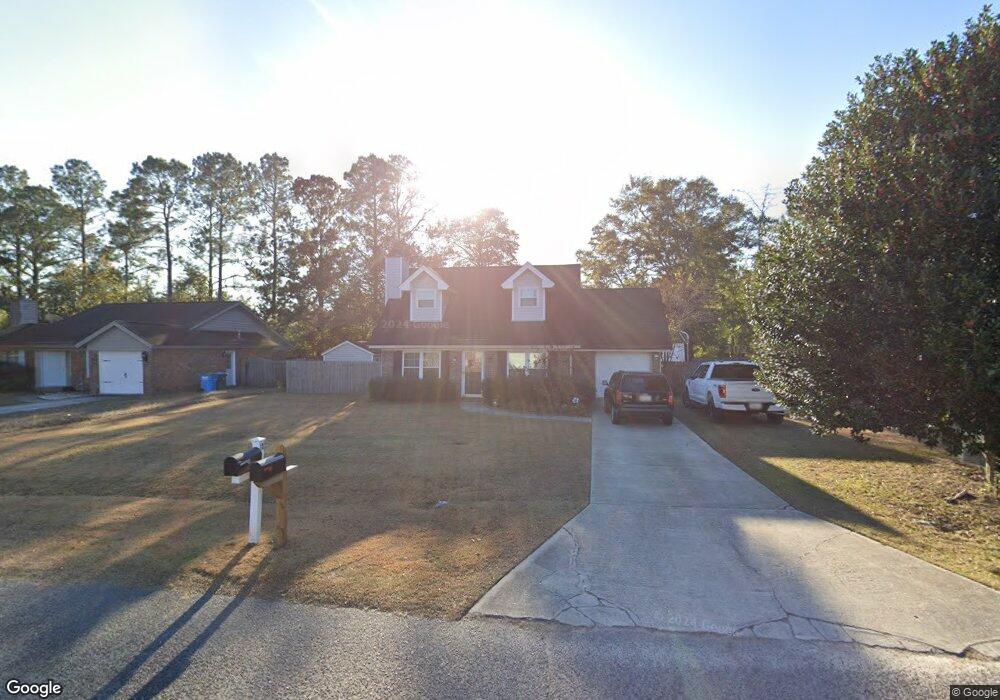
11 Walnut Way Rincon, GA 31326
Estimated Value: $249,000 - $272,000
--
Bed
1
Bath
1,442
Sq Ft
$180/Sq Ft
Est. Value
About This Home
This home is located at 11 Walnut Way, Rincon, GA 31326 and is currently estimated at $259,958, approximately $180 per square foot. 11 Walnut Way is a home located in Effingham County with nearby schools including Rincon Elementary School, Ebenezer Middle School, and Effingham County High School.
Ownership History
Date
Name
Owned For
Owner Type
Purchase Details
Closed on
Aug 14, 2020
Sold by
Phillips Jerald L
Bought by
Phillips Jerald L and Phillips Shannon
Current Estimated Value
Home Financials for this Owner
Home Financials are based on the most recent Mortgage that was taken out on this home.
Original Mortgage
$82,300
Outstanding Balance
$38,755
Interest Rate
2.9%
Mortgage Type
FHA
Estimated Equity
$221,203
Purchase Details
Closed on
Aug 12, 2020
Sold by
Reddick Heather Millie
Bought by
Phillips Jerald L
Home Financials for this Owner
Home Financials are based on the most recent Mortgage that was taken out on this home.
Original Mortgage
$82,300
Outstanding Balance
$38,755
Interest Rate
2.9%
Mortgage Type
FHA
Estimated Equity
$221,203
Purchase Details
Closed on
May 6, 2005
Sold by
Phillips Jearld
Bought by
Phillips Jerald and Phillips Heather M
Create a Home Valuation Report for This Property
The Home Valuation Report is an in-depth analysis detailing your home's value as well as a comparison with similar homes in the area
Home Values in the Area
Average Home Value in this Area
Purchase History
| Date | Buyer | Sale Price | Title Company |
|---|---|---|---|
| Phillips Jerald L | -- | -- | |
| Phillips Jerald L | -- | -- | |
| Phillips Jerald | -- | -- |
Source: Public Records
Mortgage History
| Date | Status | Borrower | Loan Amount |
|---|---|---|---|
| Open | Phillips Jerald L | $82,300 |
Source: Public Records
Tax History Compared to Growth
Tax History
| Year | Tax Paid | Tax Assessment Tax Assessment Total Assessment is a certain percentage of the fair market value that is determined by local assessors to be the total taxable value of land and additions on the property. | Land | Improvement |
|---|---|---|---|---|
| 2025 | $2,266 | $82,325 | $22,800 | $59,525 |
| 2024 | $2,266 | $83,070 | $22,800 | $60,270 |
| 2023 | $1,776 | $72,852 | $17,600 | $55,252 |
| 2022 | $1,439 | $60,854 | $17,600 | $43,254 |
| 2021 | $1,418 | $56,780 | $14,000 | $42,780 |
| 2020 | $1,382 | $50,362 | $12,000 | $38,362 |
| 2019 | $1,232 | $45,858 | $12,000 | $33,858 |
| 2018 | $1,198 | $45,640 | $10,000 | $35,640 |
| 2017 | $1,216 | $45,640 | $10,000 | $35,640 |
| 2016 | $1,249 | $46,500 | $16,000 | $30,500 |
| 2015 | -- | $42,500 | $12,000 | $30,500 |
| 2014 | -- | $42,500 | $12,000 | $30,500 |
| 2013 | -- | $35,673 | $6,400 | $29,273 |
Source: Public Records
Map
Nearby Homes
- 107 Amber Dr
- 22 Lauren Way
- 811 Walthour Dr
- 201 Walthour Dr
- 304 Stephanie Ave
- 316 Merion Rd
- 105 Saint Andrews Rd
- 226 Oxford Cir
- 315 Jessica Ln
- 305 Walthour Dr
- 402 Walthour Dr
- 0 Magnolia Dr
- 109 Big Cypress Ct
- 0 Hwy 21 Unit 285997
- 114 Stonewalk Dr
- 107 Stonewalk Dr
- 114 Reese Way
- 611 Dresler Rd
- 110 Barnwell Ave
- 151 Gavin Way
- 9 Walnut Way
- 15 Walnut Way
- 5 Walnut Way
- 10 Walnut Way Unit 21
- 10 Walnut Way
- 19 Walnut Way
- 20 Walnut Way
- 6 Walnut Way
- 119 Willowpeg Way
- 23 Walnut Way
- 1 Walnut Way
- 0 Hickory Knob Unit 7562120
- 0 Hickory Knob Unit 8023893
- 27 Walnut Way
- 2 Walnut Way
- 30 Walnut Way
- 123 Willowpeg Way
- 31 Walnut Way
- 17 Hickory Rd
- 333 Weisenbaker Rd