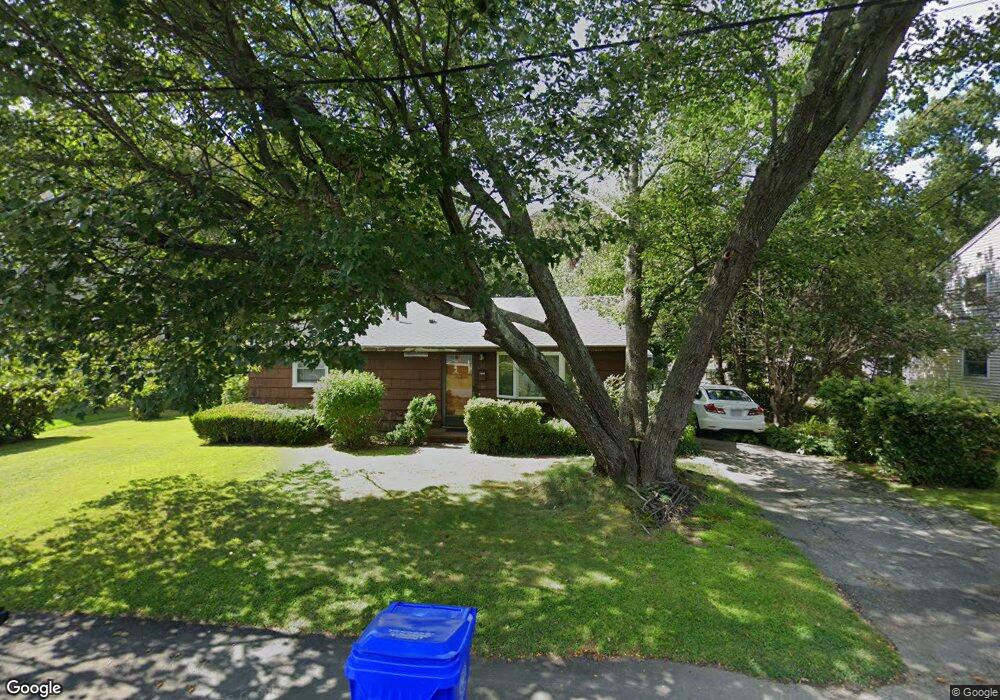
11 Walsh Rd Bedford, MA 01730
Estimated Value: $575,000 - $690,018
2
Beds
1
Bath
969
Sq Ft
$668/Sq Ft
Est. Value
About This Home
This home is located at 11 Walsh Rd, Bedford, MA 01730 and is currently estimated at $647,755, approximately $668 per square foot. 11 Walsh Rd is a home located in Middlesex County with nearby schools including Lt. Elezer Davis Elementary School, Lt .Job Lane Elementary School, and John Glenn Middle School.
Ownership History
Date
Name
Owned For
Owner Type
Purchase Details
Closed on
Jun 24, 1994
Sold by
Wright Betty L Est
Bought by
Queenan David M and Moran-Queenan Pat
Current Estimated Value
Home Financials for this Owner
Home Financials are based on the most recent Mortgage that was taken out on this home.
Original Mortgage
$122,000
Interest Rate
8.74%
Mortgage Type
Purchase Money Mortgage
Create a Home Valuation Report for This Property
The Home Valuation Report is an in-depth analysis detailing your home's value as well as a comparison with similar homes in the area
Home Values in the Area
Average Home Value in this Area
Purchase History
| Date | Buyer | Sale Price | Title Company |
|---|---|---|---|
| Queenan David M | $146,000 | -- |
Source: Public Records
Mortgage History
| Date | Status | Borrower | Loan Amount |
|---|---|---|---|
| Closed | Queenan David M | $122,000 |
Source: Public Records
Tax History
| Year | Tax Paid | Tax Assessment Tax Assessment Total Assessment is a certain percentage of the fair market value that is determined by local assessors to be the total taxable value of land and additions on the property. | Land | Improvement |
|---|---|---|---|---|
| 2025 | $65 | $543,900 | $444,400 | $99,500 |
| 2024 | $6,153 | $517,900 | $423,200 | $94,700 |
| 2023 | $5,922 | $474,500 | $399,700 | $74,800 |
| 2022 | $6,125 | $451,000 | $384,000 | $67,000 |
| 2021 | $5,996 | $443,200 | $376,200 | $67,000 |
| 2020 | $6,048 | $458,900 | $391,900 | $67,000 |
| 2019 | $5,937 | $458,100 | $391,900 | $66,200 |
| 2018 | $5,699 | $399,400 | $335,800 | $63,600 |
| 2017 | $5,412 | $397,900 | $327,600 | $70,300 |
| 2016 | $5,625 | $368,119 | $297,800 | $70,319 |
| 2015 | $5,376 | $367,744 | $297,800 | $69,944 |
| 2014 | $5,539 | $352,600 | $282,200 | $70,400 |
Source: Public Records
Map
Nearby Homes
- 6 Lane Ave
- 36 Loomis St Unit 104
- 36 Loomis St Unit 301
- 36 Loomis St Unit 404
- 10 Webber Ave Unit 101
- 10 Webber Ave Unit 102
- 41 Dunster Rd
- 104 Page Rd
- 93 Springs Rd
- 37 Pine St
- 39 Neillian St Unit 39
- 41 Neillian St Unit 41
- 10 Nickerson Rd
- 16 Sunnyfield Rd
- 1 Cushing St
- 10 Mickelson Ln Unit 10
- 83 Winter St
- 18 Hemlock Ln Unit A
- 18 Hemlock Ln Unit B
- 186 Concord Rd
Your Personal Tour Guide
Ask me questions while you tour the home.