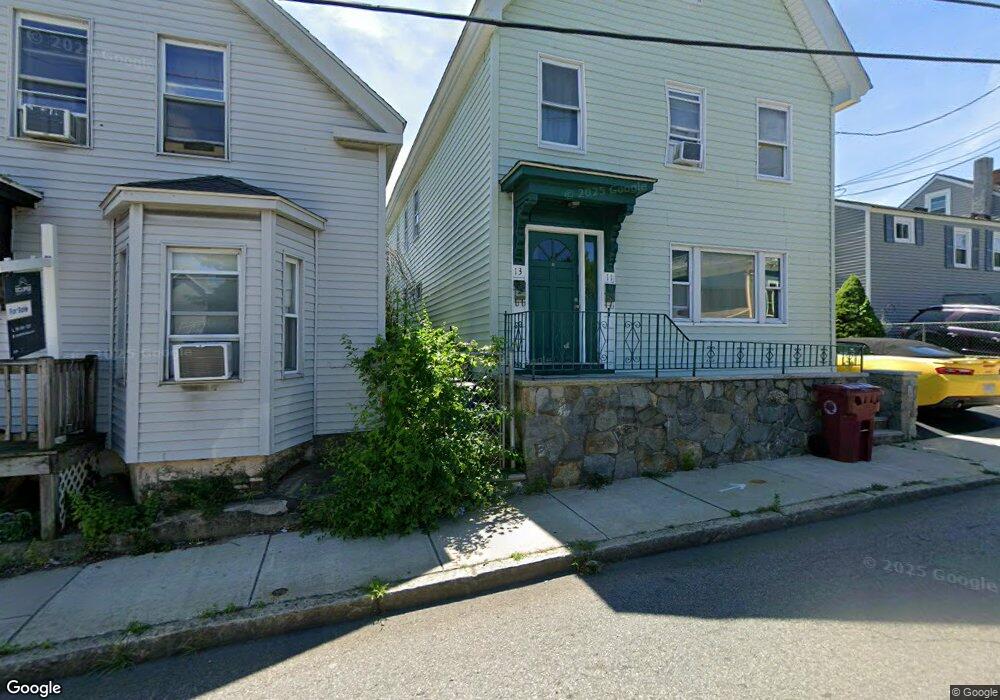
11 Wamesit St Lowell, MA 01852
Back Central NeighborhoodEstimated Value: $505,724 - $680,000
6
Beds
2
Baths
2,803
Sq Ft
$212/Sq Ft
Est. Value
About This Home
This home is located at 11 Wamesit St, Lowell, MA 01852 and is currently estimated at $594,181, approximately $211 per square foot. 11 Wamesit St is a home located in Middlesex County with nearby schools including Moody Elementary School, Abraham Lincoln Elementary School, and Greenhalge Elementary School.
Ownership History
Date
Name
Owned For
Owner Type
Purchase Details
Closed on
May 26, 2016
Sold by
Bank New York Mellon T
Bought by
Silva Jose and Silva Mary
Current Estimated Value
Purchase Details
Closed on
Oct 3, 2008
Sold by
Bank Of New York
Bought by
Silva Jose and Silva Mary
Purchase Details
Closed on
Aug 7, 2008
Sold by
Nsubuga Hope and Kirabo Hope
Bought by
Bank Of New York
Purchase Details
Closed on
Jul 1, 2004
Sold by
Pham Huong Thi-Thu and Tran Trung Ba
Bought by
Nsubuga Hope and Kirabo Kope
Home Financials for this Owner
Home Financials are based on the most recent Mortgage that was taken out on this home.
Original Mortgage
$232,000
Interest Rate
6.3%
Mortgage Type
Purchase Money Mortgage
Create a Home Valuation Report for This Property
The Home Valuation Report is an in-depth analysis detailing your home's value as well as a comparison with similar homes in the area
Home Values in the Area
Average Home Value in this Area
Purchase History
| Date | Buyer | Sale Price | Title Company |
|---|---|---|---|
| Silva Jose | $100,000 | -- | |
| Silva Jose | $100,000 | -- | |
| Silva Jose | $100,000 | -- | |
| Bank Of New York | $101,700 | -- | |
| Bank Of New York | $101,700 | -- | |
| Nsubuga Hope | $290,000 | -- | |
| Nsubuga Hope | $290,000 | -- |
Source: Public Records
Mortgage History
| Date | Status | Borrower | Loan Amount |
|---|---|---|---|
| Previous Owner | Nsubuga Hope | $232,000 |
Source: Public Records
Tax History
| Year | Tax Paid | Tax Assessment Tax Assessment Total Assessment is a certain percentage of the fair market value that is determined by local assessors to be the total taxable value of land and additions on the property. | Land | Improvement |
|---|---|---|---|---|
| 2025 | $5,791 | $504,400 | $103,000 | $401,400 |
| 2024 | $5,336 | $448,000 | $92,900 | $355,100 |
| 2023 | $4,967 | $399,900 | $80,800 | $319,100 |
| 2022 | $4,471 | $352,300 | $63,700 | $288,600 |
| 2021 | $4,147 | $308,100 | $55,400 | $252,700 |
| 2020 | $3,730 | $279,200 | $46,200 | $233,000 |
| 2019 | $3,497 | $249,100 | $42,800 | $206,300 |
| 2018 | $3,244 | $225,400 | $40,700 | $184,700 |
| 2017 | $3,178 | $213,000 | $44,400 | $168,600 |
| 2016 | $3,232 | $213,200 | $44,600 | $168,600 |
Source: Public Records
Map
Nearby Homes
- 31 Merrill St
- 5 Floyd St
- 39 Groves Ave
- 80 Rogers St Unit 204
- 8 Cedar Ct
- 189 Charles St
- 7 Butler Ave Unit 5
- 88 Perry St
- 85 Kinsman St
- 95 S Highland St
- 254 Pleasant St
- 21 Agawam St
- 810 Lawrence St Unit C
- 191 Thorndike St Unit 26
- 201 Thorndike St Unit 501
- 201 Thorndike St Unit 2-312
- 201 Thorndike St Unit 505
- 200 Rogers St Unit 6
- 278-316 Middlesex St
- 44 Hanks St
- 17 Wamesit St
- 708 Central St
- 7 Wamesit St
- 19 Wamesit St
- 710 Central St
- 24 Wamesit St
- 18 Abbott St
- 10 Abbott St
- 14 Abbott St
- 22 Wamesit St
- 22 Wamesit St Unit 1
- 22 Wamesit St Unit 2
- 22 Abbott St
- 648 Central Street-649000
- 29 Wamesit St
- 11 Abbott St
- 7 Abbott St
- 15 Abbott St
- 28 Wamesit St
- 11 Mill St Unit 1
Your Personal Tour Guide
Ask me questions while you tour the home.