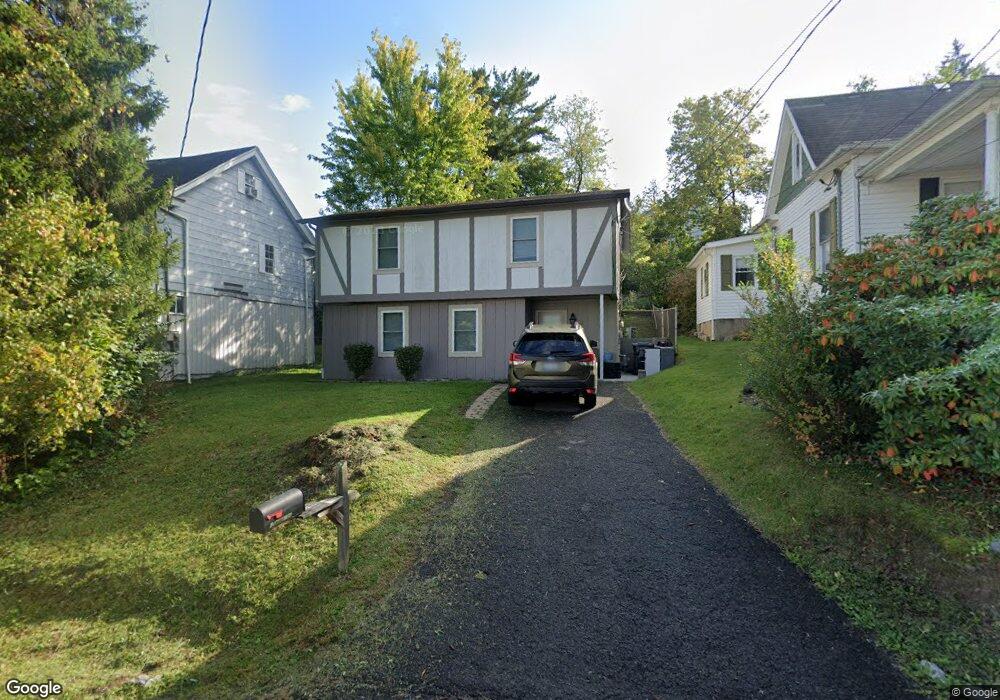
11 Warrick St Morgantown, WV 26505
Wiles Hill-Highland Park NeighborhoodEstimated Value: $229,459 - $251,000
3
Beds
2
Baths
1,463
Sq Ft
$165/Sq Ft
Est. Value
About This Home
This home is located at 11 Warrick St, Morgantown, WV 26505 and is currently estimated at $241,865, approximately $165 per square foot. 11 Warrick St is a home located in Monongalia County with nearby schools including Suncrest Elementary School, Suncrest Middle School, and Morgantown High School.
Ownership History
Date
Name
Owned For
Owner Type
Purchase Details
Closed on
Jul 16, 2021
Sold by
Lopez Flores Nicolas and Lopez Flores Norma
Bought by
Gluth Benjamin and Gluth Teresa
Current Estimated Value
Home Financials for this Owner
Home Financials are based on the most recent Mortgage that was taken out on this home.
Original Mortgage
$175,750
Outstanding Balance
$159,539
Interest Rate
2.93%
Mortgage Type
New Conventional
Estimated Equity
$82,326
Purchase Details
Closed on
Dec 9, 2019
Sold by
Weber Enterprises Llc
Bought by
Lopez Flores Nicolas and Lopez Flores Norma
Home Financials for this Owner
Home Financials are based on the most recent Mortgage that was taken out on this home.
Original Mortgage
$140,800
Interest Rate
3.1%
Mortgage Type
New Conventional
Purchase Details
Closed on
Mar 8, 2010
Sold by
Weber Jeffrey S
Bought by
Weber Enterprises Llc
Create a Home Valuation Report for This Property
The Home Valuation Report is an in-depth analysis detailing your home's value as well as a comparison with similar homes in the area
Home Values in the Area
Average Home Value in this Area
Purchase History
| Date | Buyer | Sale Price | Title Company |
|---|---|---|---|
| Gluth Benjamin | $187,500 | None Available | |
| Lopez Flores Nicolas | $176,000 | None Available | |
| Weber Enterprises Llc | -- | None Available |
Source: Public Records
Mortgage History
| Date | Status | Borrower | Loan Amount |
|---|---|---|---|
| Open | Gluth Benjamin | $175,750 | |
| Previous Owner | Lopez Flores Nicolas | $140,800 |
Source: Public Records
Tax History Compared to Growth
Tax History
| Year | Tax Paid | Tax Assessment Tax Assessment Total Assessment is a certain percentage of the fair market value that is determined by local assessors to be the total taxable value of land and additions on the property. | Land | Improvement |
|---|---|---|---|---|
| 2024 | $1,228 | $93,120 | $30,900 | $62,220 |
| 2023 | $1,225 | $93,120 | $30,900 | $62,220 |
| 2022 | $1,173 | $91,980 | $30,900 | $61,080 |
| 2021 | $964 | $75,300 | $30,900 | $44,400 |
| 2020 | $975 | $75,900 | $30,900 | $45,000 |
| 2019 | $1,961 | $75,900 | $30,900 | $45,000 |
| 2018 | $1,854 | $71,580 | $30,900 | $40,680 |
| 2017 | $1,831 | $70,380 | $29,100 | $41,280 |
| 2016 | $1,776 | $67,920 | $26,640 | $41,280 |
| 2015 | $1,665 | $66,000 | $24,180 | $41,820 |
| 2014 | $1,531 | $63,060 | $21,840 | $41,220 |
Source: Public Records
Map
Nearby Homes
- 528 Beverly Ave
- 445 Center St
- Lot 1 Dolce Vita Dr
- 644 8th St
- 321 8th St
- Lot 2 Dolce Vita Dr
- Lot 3 Dolce Vita Dr
- 277 Randolph Rd
- 1901 Bryant St
- 53 Highland Ave
- 255 Spring St
- Lot 4 Dolce Vita Dr
- Lot 7 Dolce Vita Dr
- 0 Lorentz St Unit WVMG2000128
- 0 Lorentz St Unit PARCEL 314
- Parcel 312 Lorentz St
- Lot 9 Dolce Vita Dr
- 107 Ridgeley Rd
- Lot 5 Dolce Vita Dr
- Lot 10 Dolce Vita Dr
- 9 Warrick St
- 15 Warrick St
- 7 Warrick St
- 653 Jones Ave
- 661 Jones Ave
- 17 Warrick St
- 665 Jones Ave
- 2588 University Ave
- 659 Jones Ave
- 2587 University Ave
- 633 Jones Ave
- 671 Jones Ave
- 2585 University Ave
- 2589 University Ave
- 19 Warrick St
- 2577 University Ave
- 2596 University Ave
- 675 Jones Ave
- 2575 University Ave
- 662 Jones Ave