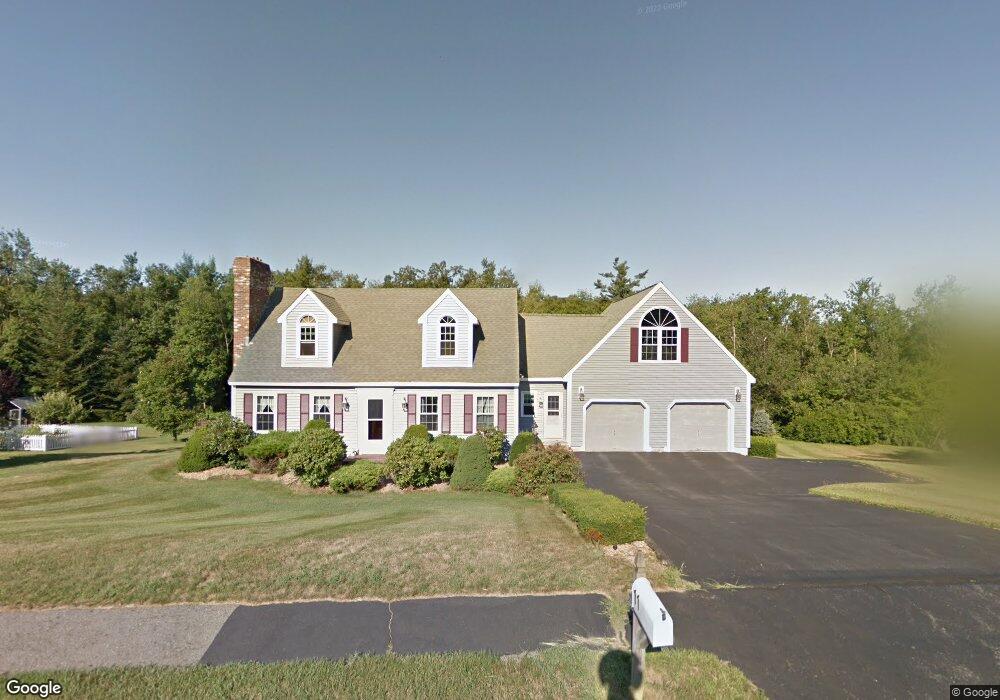
11 Watson Ln Rutland, MA 01543
Estimated Value: $531,950 - $644,000
2
Beds
1
Bath
1,656
Sq Ft
$359/Sq Ft
Est. Value
About This Home
This home is located at 11 Watson Ln, Rutland, MA 01543 and is currently estimated at $594,988, approximately $359 per square foot. 11 Watson Ln is a home located in Worcester County with nearby schools including Wachusett Regional High School.
Ownership History
Date
Name
Owned For
Owner Type
Purchase Details
Closed on
Jul 14, 2003
Sold by
Horrigan Anjanette M and Zoppo Anjanette M
Bought by
Horrigan Anjanette M and Horrigan Richard E
Current Estimated Value
Home Financials for this Owner
Home Financials are based on the most recent Mortgage that was taken out on this home.
Original Mortgage
$125,000
Interest Rate
5.45%
Mortgage Type
Purchase Money Mortgage
Purchase Details
Closed on
May 28, 1992
Sold by
Gengel C & S Bldrs Inc
Bought by
Horritgan Richard and Zoppo Anjanette
Create a Home Valuation Report for This Property
The Home Valuation Report is an in-depth analysis detailing your home's value as well as a comparison with similar homes in the area
Home Values in the Area
Average Home Value in this Area
Purchase History
| Date | Buyer | Sale Price | Title Company |
|---|---|---|---|
| Horrigan Anjanette M | -- | -- | |
| Horritgan Richard | $134,000 | -- |
Source: Public Records
Mortgage History
| Date | Status | Borrower | Loan Amount |
|---|---|---|---|
| Open | Horritgan Richard | $177,000 | |
| Closed | Horritgan Richard | $185,000 | |
| Closed | Horrigan Anjanette M | $125,000 | |
| Previous Owner | Horritgan Richard | $10,000 | |
| Previous Owner | Horritgan Richard | $106,000 |
Source: Public Records
Tax History
| Year | Tax Paid | Tax Assessment Tax Assessment Total Assessment is a certain percentage of the fair market value that is determined by local assessors to be the total taxable value of land and additions on the property. | Land | Improvement |
|---|---|---|---|---|
| 2025 | $7,198 | $505,500 | $114,100 | $391,400 |
| 2024 | $7,056 | $475,800 | $106,700 | $369,100 |
| 2023 | $6,446 | $469,800 | $100,600 | $369,200 |
| 2022 | $6,401 | $405,400 | $83,600 | $321,800 |
| 2021 | $6,369 | $381,400 | $90,700 | $290,700 |
| 2020 | $6,301 | $357,800 | $81,200 | $276,600 |
| 2019 | $6,251 | $349,400 | $70,100 | $279,300 |
| 2018 | $6,135 | $338,400 | $70,100 | $268,300 |
| 2017 | $5,635 | $307,600 | $70,100 | $237,500 |
| 2016 | $5,152 | $296,600 | $73,700 | $222,900 |
| 2015 | $4,766 | $270,000 | $73,700 | $196,300 |
| 2014 | $4,620 | $270,000 | $73,700 | $196,300 |
Source: Public Records
Map
Nearby Homes
- 22 Village Way
- 11 Lewis St
- 21 Lewis St
- 28 Forest Hill Dr
- 27 Lewis St
- 8 Vista Cir
- 12 Lewis St
- 6 Lewis St
- 10 Soucy Dr
- 14 Richards Ave
- 12 Central Tree Rd Unit 2
- 85 Maple Ave Unit A
- 210 Fidelity Dr Unit 84
- 212 Fidelity Dr Unit 83
- 10 Fidelity Dr Unit 5
- 12 Fidelity Dr Unit 6
- 18 Fidelity Dr Unit 9
- 20 Fidelity Dr Unit 10
- 15 Fidelity Dr Unit 70
- 14 Grizzly Dr
Your Personal Tour Guide
Ask me questions while you tour the home.