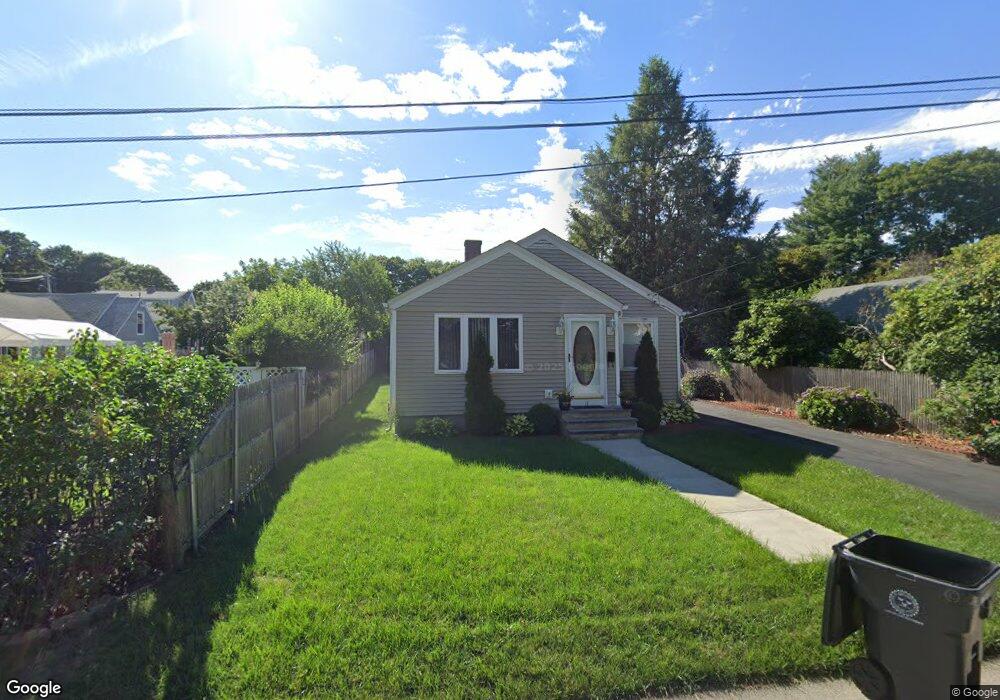
11 Welfare St East Providence, RI 02914
Kent Heights NeighborhoodEstimated Value: $389,566 - $424,000
3
Beds
1
Bath
1,073
Sq Ft
$379/Sq Ft
Est. Value
About This Home
This home is located at 11 Welfare St, East Providence, RI 02914 and is currently estimated at $406,642, approximately $378 per square foot. 11 Welfare St is a home located in Providence County with nearby schools including East Providence High School, The Gordon School, and Ocean State Montessori School.
Ownership History
Date
Name
Owned For
Owner Type
Purchase Details
Closed on
Apr 17, 1997
Sold by
Grasso Nancy A
Bought by
Bento Gilberto A and Bento Teresinha
Current Estimated Value
Home Financials for this Owner
Home Financials are based on the most recent Mortgage that was taken out on this home.
Original Mortgage
$42,000
Outstanding Balance
$5,102
Interest Rate
7.76%
Mortgage Type
Purchase Money Mortgage
Estimated Equity
$401,540
Create a Home Valuation Report for This Property
The Home Valuation Report is an in-depth analysis detailing your home's value as well as a comparison with similar homes in the area
Home Values in the Area
Average Home Value in this Area
Purchase History
| Date | Buyer | Sale Price | Title Company |
|---|---|---|---|
| Bento Gilberto A | $92,000 | -- | |
| Bento Gilberto A | $92,000 | -- |
Source: Public Records
Mortgage History
| Date | Status | Borrower | Loan Amount |
|---|---|---|---|
| Open | Bento Gilberto A | $42,000 | |
| Closed | Bento Gilberto A | $42,000 |
Source: Public Records
Tax History Compared to Growth
Tax History
| Year | Tax Paid | Tax Assessment Tax Assessment Total Assessment is a certain percentage of the fair market value that is determined by local assessors to be the total taxable value of land and additions on the property. | Land | Improvement |
|---|---|---|---|---|
| 2025 | $4,998 | $382,400 | $121,200 | $261,200 |
| 2024 | $4,850 | $316,400 | $101,100 | $215,300 |
| 2023 | $4,670 | $316,400 | $101,100 | $215,300 |
| 2022 | $4,483 | $205,100 | $56,900 | $148,200 |
| 2021 | $4,410 | $205,100 | $54,700 | $150,400 |
| 2020 | $4,223 | $205,100 | $54,700 | $150,400 |
| 2019 | $4,106 | $205,100 | $54,700 | $150,400 |
| 2018 | $4,359 | $190,500 | $55,900 | $134,600 |
| 2017 | $4,261 | $190,500 | $55,900 | $134,600 |
| 2016 | $4,241 | $190,500 | $55,900 | $134,600 |
| 2015 | $3,908 | $170,300 | $49,300 | $121,000 |
| 2014 | $3,908 | $170,300 | $49,300 | $121,000 |
Source: Public Records
Map
Nearby Homes
- 25 Ide Ave
- 26 Mayflower St
- 25 Fairview Ave
- 132 S Rose St
- 17 Brown St Unit 19
- 180 Grassmere Ave
- 109 Bliss St
- 108 Bliss St
- 11 N Rose St
- 74 Brookhaven Dr
- 53 Wampanoag Trail
- 82 Martin St
- 9 Apulia St
- 400 Juniper St Unit A
- 400 Juniper St Unit B
- 400 Juniper St Unit C
- 108 Ivan Ave
- 87 Vincent Ave
- 10 Fairfield Ave
- 78 Ingraham St