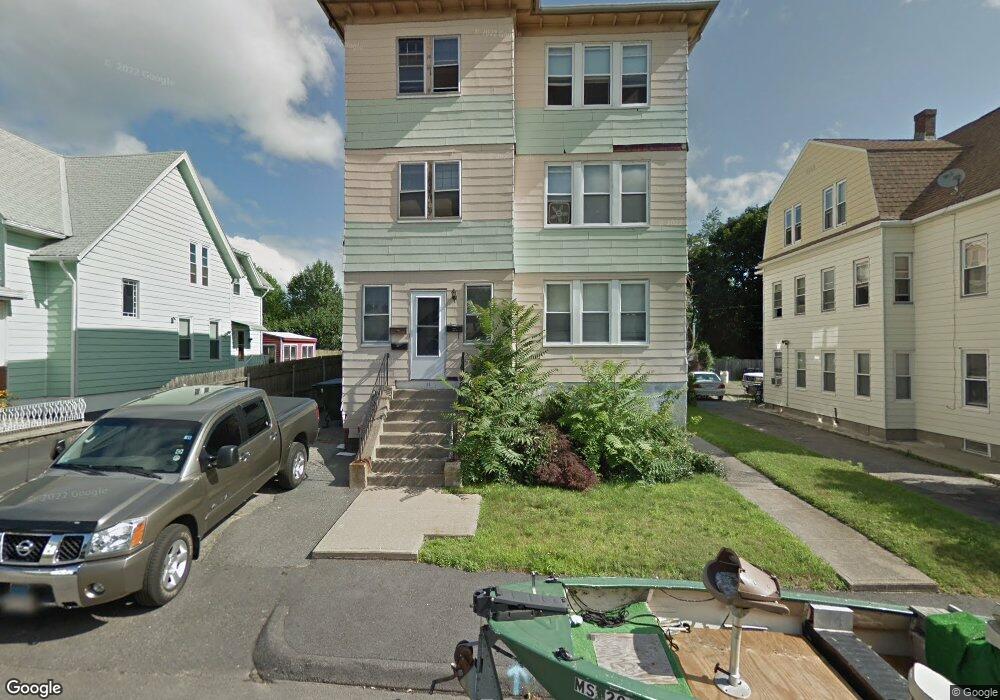
11 Wells St Worcester, MA 01604
Hamilton NeighborhoodEstimated Value: $625,461 - $758,000
6
Beds
3
Baths
3,636
Sq Ft
$188/Sq Ft
Est. Value
About This Home
This home is located at 11 Wells St, Worcester, MA 01604 and is currently estimated at $682,615, approximately $187 per square foot. 11 Wells St is a home located in Worcester County with nearby schools including Jacob Hiatt Magnet School, Chandler Magnet, and Lake View Elementary School.
Ownership History
Date
Name
Owned For
Owner Type
Purchase Details
Closed on
Oct 17, 2003
Sold by
Ricciardi Stephan M and Ricciardi Wendy M
Bought by
Higgins Michael
Current Estimated Value
Home Financials for this Owner
Home Financials are based on the most recent Mortgage that was taken out on this home.
Original Mortgage
$289,275
Outstanding Balance
$137,026
Interest Rate
6.43%
Mortgage Type
Purchase Money Mortgage
Estimated Equity
$545,589
Purchase Details
Closed on
Nov 20, 1992
Sold by
Uccello Samuel
Bought by
Marchand Wendy M
Home Financials for this Owner
Home Financials are based on the most recent Mortgage that was taken out on this home.
Original Mortgage
$99,034
Interest Rate
7.95%
Mortgage Type
Purchase Money Mortgage
Create a Home Valuation Report for This Property
The Home Valuation Report is an in-depth analysis detailing your home's value as well as a comparison with similar homes in the area
Home Values in the Area
Average Home Value in this Area
Purchase History
We collect this data history from publicly available records. To have your information removed, we recommend requesting removal directly through your county’s website.
| Date | Buyer | Sale Price | Title Company |
|---|---|---|---|
| Higgins Michael | $306,000 | -- | |
| Marchand Wendy M | $100,000 | -- |
Source: Public Records
Mortgage History
We collect this data history from publicly available records. To have your information removed, we recommend requesting removal directly through your county’s website.
| Date | Status | Borrower | Loan Amount |
|---|---|---|---|
| Open | Higgins Michael | $289,275 | |
| Previous Owner | Marchand Wendy M | $100,000 | |
| Previous Owner | Marchand Wendy M | $30,000 | |
| Previous Owner | Marchand Wendy M | $103,000 | |
| Previous Owner | Marchand Wendy M | $99,034 |
Source: Public Records
Tax History
| Year | Tax Paid | Tax Assessment Tax Assessment Total Assessment is a certain percentage of the fair market value that is determined by local assessors to be the total taxable value of land and additions on the property. | Land | Improvement |
|---|---|---|---|---|
| 2025 | $7,512 | $569,500 | $101,900 | $467,600 |
| 2024 | $6,962 | $506,300 | $101,900 | $404,400 |
| 2023 | $6,654 | $464,000 | $88,600 | $375,400 |
| 2022 | $5,787 | $380,500 | $70,900 | $309,600 |
| 2021 | $5,143 | $315,900 | $56,700 | $259,200 |
| 2020 | $4,321 | $254,200 | $56,700 | $197,500 |
| 2019 | $4,316 | $239,800 | $51,000 | $188,800 |
| 2018 | $4,238 | $224,100 | $51,000 | $173,100 |
| 2017 | $3,996 | $207,900 | $51,000 | $156,900 |
| 2016 | $3,052 | $148,100 | $38,200 | $109,900 |
| 2015 | $2,972 | $148,100 | $38,200 | $109,900 |
| 2014 | $2,894 | $148,100 | $38,200 | $109,900 |
Source: Public Records
Map
Nearby Homes
- 327 Plantation St Unit 312
- 22 Frank St
- 8 Carver St
- 812 Franklin St Unit A
- 13 Prentice St
- 16 Caprera Rd
- 65 Lake Ave Unit 1008
- 65 Lake Ave Unit 508
- 109 Alvarado Ave
- 25 Johnson St
- 1 Envelope Terrace Unit 309
- 135 Lake Ave
- 1 Ayrshire Rd
- 29 Chilmark St
- 80 Stanton St Unit 36
- 1 Verdi Rd
- 68 S Quinsigamond Ave Unit 4
- 14 Belcourt Rd
- 360 Hamilton St
- 6 Harrington Way
Your Personal Tour Guide
Ask me questions while you tour the home.