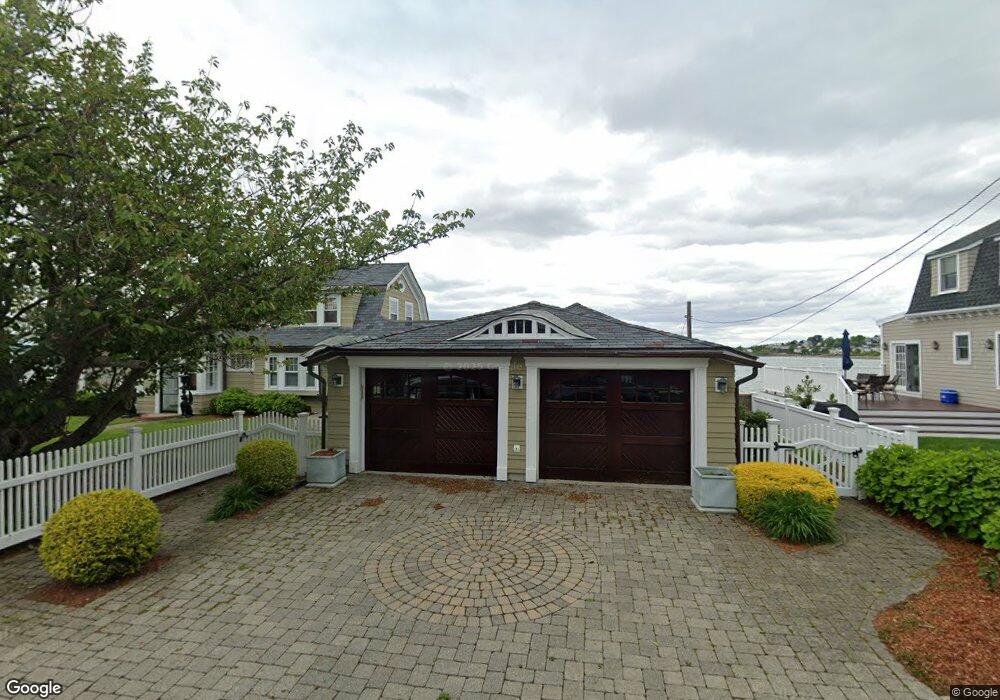
11 Wendell Rd Nahant, MA 01908
Estimated Value: $1,562,000 - $2,016,000
5
Beds
3
Baths
2,700
Sq Ft
$681/Sq Ft
Est. Value
About This Home
This home is located at 11 Wendell Rd, Nahant, MA 01908 and is currently estimated at $1,837,684, approximately $680 per square foot. 11 Wendell Rd is a home with nearby schools including Johnson Elementary School, Swampscott Middle School, and Swampscott High School.
Ownership History
Date
Name
Owned For
Owner Type
Purchase Details
Closed on
Aug 15, 2005
Sold by
Robinson Lawrence
Bought by
11 Wendell Road Llc
Current Estimated Value
Purchase Details
Closed on
Feb 24, 2003
Sold by
Robinson Lawrence and Marsh Mildred Hazel
Bought by
Robinson Lawrence
Create a Home Valuation Report for This Property
The Home Valuation Report is an in-depth analysis detailing your home's value as well as a comparison with similar homes in the area
Home Values in the Area
Average Home Value in this Area
Purchase History
| Date | Buyer | Sale Price | Title Company |
|---|---|---|---|
| 11 Wendell Road Llc | $1,750,000 | -- | |
| 11 Wendell Road Llc | $1,750,000 | -- | |
| Robinson Lawrence | $566,667 | -- | |
| Robinson Lawrence | $283,333 | -- | |
| Robinson Lawrence | $283,333 | -- |
Source: Public Records
Mortgage History
| Date | Status | Borrower | Loan Amount |
|---|---|---|---|
| Open | Robinson Lawrence | $1,850,000 | |
| Previous Owner | Robinson Lawrence | $1,419,000 | |
| Previous Owner | Robinson Lawrence | $650,000 |
Source: Public Records
Tax History
| Year | Tax Paid | Tax Assessment Tax Assessment Total Assessment is a certain percentage of the fair market value that is determined by local assessors to be the total taxable value of land and additions on the property. | Land | Improvement |
|---|---|---|---|---|
| 2025 | $17,421 | $1,903,900 | $1,288,000 | $615,900 |
| 2024 | $16,711 | $1,842,500 | $1,226,600 | $615,900 |
| 2023 | $16,188 | $1,780,900 | $1,189,800 | $591,100 |
| 2022 | $15,787 | $1,612,600 | $1,079,400 | $533,200 |
| 2021 | $15,824 | $1,505,600 | $981,300 | $524,300 |
| 2020 | $16,726 | $1,524,700 | $1,154,500 | $370,200 |
| 2019 | $16,360 | $1,499,500 | $1,000,100 | $499,400 |
| 2018 | $14,282 | $1,393,400 | $905,400 | $488,000 |
| 2017 | $14,589 | $1,393,400 | $905,400 | $488,000 |
| 2016 | $13,986 | $1,329,500 | $879,500 | $450,000 |
| 2015 | $13,636 | $1,248,700 | $798,700 | $450,000 |
| 2014 | $13,773 | $1,248,700 | $798,700 | $450,000 |
Source: Public Records
Map
Nearby Homes
- 30 Sherman Ave
- 1 Goddard Dr
- 183 Bass Point Rd
- 9 Little Nahant Rd
- 66 Ocean St
- 162 Willow Rd Unit 11
- 51 Cliff St
- 1 Carey Cir Unit 409
- 191 N Shore Rd
- 123 Mills Ave
- 11 Archer Ave
- 31 Mills Ave
- 510 Revere Beach Blvd Unit 1205
- 510 Revere Beach Blvd Unit 905
- 505 Revere Beach Blvd Unit 303
- 98 Lynnway
- 12 Chancery Ct Unit 404
- 154 Lynnway Unit 210
- 154 Lynnway Unit 205
- 474 Revere Beach Blvd Unit 501
Your Personal Tour Guide
Ask me questions while you tour the home.