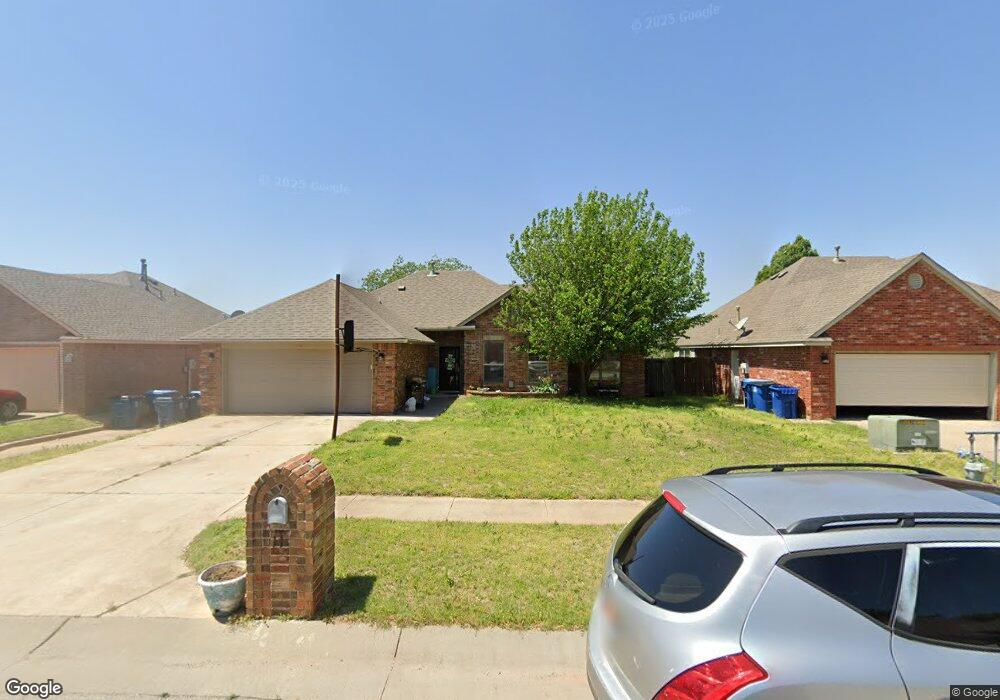
11 Westend Ct Tuttle, OK 73089
Estimated Value: $230,000 - $262,000
3
Beds
2
Baths
1,400
Sq Ft
$174/Sq Ft
Est. Value
About This Home
This home is located at 11 Westend Ct, Tuttle, OK 73089 and is currently estimated at $244,299, approximately $174 per square foot. 11 Westend Ct is a home located in Grady County with nearby schools including Tuttle Intermediate School, Tuttle Elementary School, and Tuttle Middle School.
Ownership History
Date
Name
Owned For
Owner Type
Purchase Details
Closed on
Jul 27, 2005
Sold by
Metroplex Building Co Llc
Bought by
Carroll James C and Carroll Jill C
Current Estimated Value
Home Financials for this Owner
Home Financials are based on the most recent Mortgage that was taken out on this home.
Original Mortgage
$89,000
Outstanding Balance
$46,309
Interest Rate
5.61%
Mortgage Type
New Conventional
Estimated Equity
$197,990
Purchase Details
Closed on
Jul 15, 2005
Sold by
Metroplex Building Co Llc
Bought by
Metroplex Building Co Llc
Home Financials for this Owner
Home Financials are based on the most recent Mortgage that was taken out on this home.
Original Mortgage
$89,000
Outstanding Balance
$46,309
Interest Rate
5.61%
Mortgage Type
New Conventional
Estimated Equity
$197,990
Purchase Details
Closed on
Jan 28, 2005
Sold by
Koeltzow Enterprises Inc
Bought by
Metroplex Building Co
Home Financials for this Owner
Home Financials are based on the most recent Mortgage that was taken out on this home.
Original Mortgage
$91,203
Interest Rate
6%
Mortgage Type
Future Advance Clause Open End Mortgage
Create a Home Valuation Report for This Property
The Home Valuation Report is an in-depth analysis detailing your home's value as well as a comparison with similar homes in the area
Home Values in the Area
Average Home Value in this Area
Purchase History
| Date | Buyer | Sale Price | Title Company |
|---|---|---|---|
| Carroll James C | -- | None Available | |
| Metroplex Building Co Llc | -- | None Available | |
| Metroplex Building Co | $11,500 | None Available |
Source: Public Records
Mortgage History
| Date | Status | Borrower | Loan Amount |
|---|---|---|---|
| Open | Carroll James C | $89,000 | |
| Previous Owner | Metroplex Building Co | $91,203 |
Source: Public Records
Tax History
| Year | Tax Paid | Tax Assessment Tax Assessment Total Assessment is a certain percentage of the fair market value that is determined by local assessors to be the total taxable value of land and additions on the property. | Land | Improvement |
|---|---|---|---|---|
| 2025 | $1,637 | $16,536 | $1,926 | $14,610 |
| 2024 | $1,710 | $16,054 | $1,870 | $14,184 |
| 2023 | $1,710 | $15,586 | $2,118 | $13,468 |
| 2022 | $1,552 | $15,132 | $1,655 | $13,477 |
| 2021 | $1,576 | $15,288 | $1,655 | $13,633 |
| 2020 | $1,598 | $15,344 | $1,655 | $13,689 |
| 2019 | $1,524 | $14,920 | $1,576 | $13,344 |
| 2018 | $1,395 | $14,485 | $1,546 | $12,939 |
| 2017 | $1,386 | $14,063 | $1,275 | $12,788 |
| 2016 | $1,367 | $13,654 | $1,226 | $12,428 |
| 2015 | $1,216 | $13,256 | $1,177 | $12,079 |
| 2014 | $1,216 | $12,870 | $1,265 | $11,605 |
Source: Public Records
Map
Nearby Homes
- 1 NW 7th St
- 10 Westend Ct
- 2 NW 6th St
- 309 Elm St
- 502 SW 5th St
- 605 SW 4th St
- 311 N Cimarron Rd
- 104 SE 2nd St
- 106 Englebretson Ln
- 901 N Cimarron Rd
- 516 Kings Ct
- 2025 E Rock Creek Rd
- 1301 E Rock Creek Rd
- 1260 E Rock Creek Rd
- 903 County Street 2910
- 1300 Ella
- 1874 E Rock Creek Rd
- 601 S Frisco Rd
- 1330 E Silver City Ridge
- 1636 Big Sky Dr
Your Personal Tour Guide
Ask me questions while you tour the home.