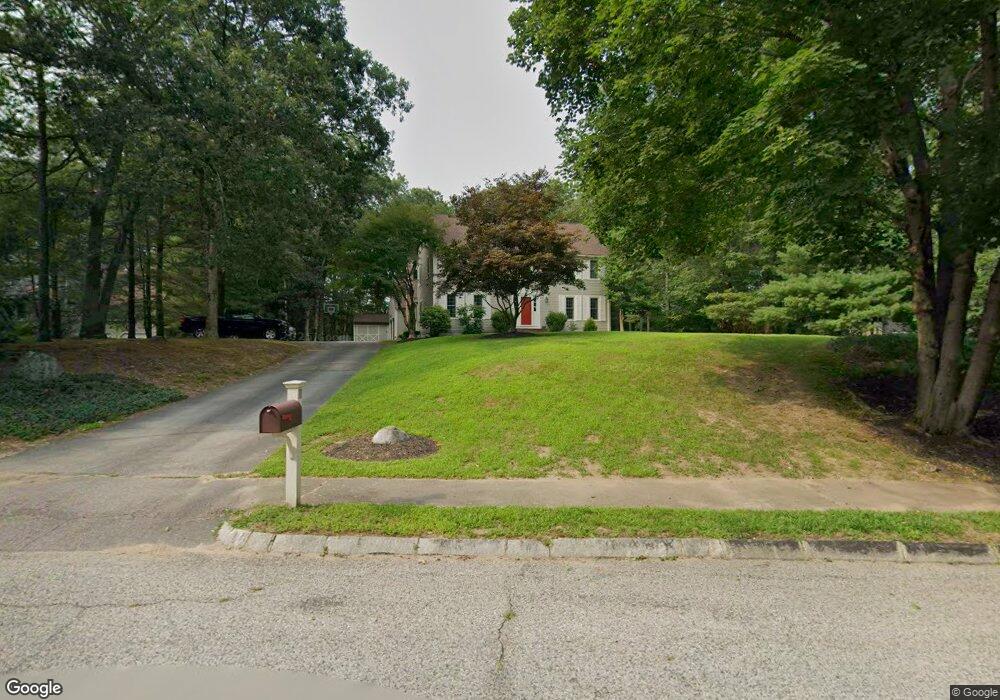
11 Westview Dr Mansfield, MA 02048
Estimated Value: $846,995 - $1,068,000
4
Beds
3
Baths
2,560
Sq Ft
$371/Sq Ft
Est. Value
About This Home
This home is located at 11 Westview Dr, Mansfield, MA 02048 and is currently estimated at $948,999, approximately $370 per square foot. 11 Westview Dr is a home located in Bristol County with nearby schools including Everett W. Robinson Elementary School, Jordan/Jackson Elementary School, and Harold L. Qualters Middle School.
Ownership History
Date
Name
Owned For
Owner Type
Purchase Details
Closed on
Oct 2, 2020
Sold by
Calabrese Joseph M and Calabrese Michele A
Bought by
Michele A Calabrese Ret
Current Estimated Value
Purchase Details
Closed on
Apr 30, 2001
Sold by
Damico Patrick H and Damico Lynda B
Bought by
Calabrese Joseph M and Calabrese Michele A
Home Financials for this Owner
Home Financials are based on the most recent Mortgage that was taken out on this home.
Original Mortgage
$179,900
Interest Rate
6.88%
Mortgage Type
Purchase Money Mortgage
Purchase Details
Closed on
Jul 2, 1996
Sold by
Mahan Thomas F and Mahan Ann Marie
Bought by
Damico Patrick H and Damico Linda B
Home Financials for this Owner
Home Financials are based on the most recent Mortgage that was taken out on this home.
Original Mortgage
$205,200
Interest Rate
8.05%
Mortgage Type
Purchase Money Mortgage
Create a Home Valuation Report for This Property
The Home Valuation Report is an in-depth analysis detailing your home's value as well as a comparison with similar homes in the area
Home Values in the Area
Average Home Value in this Area
Purchase History
| Date | Buyer | Sale Price | Title Company |
|---|---|---|---|
| Michele A Calabrese Ret | -- | None Available | |
| Calabrese Joseph M | $379,900 | -- | |
| Damico Patrick H | $256,500 | -- |
Source: Public Records
Mortgage History
| Date | Status | Borrower | Loan Amount |
|---|---|---|---|
| Previous Owner | Damico Patrick H | $179,900 | |
| Previous Owner | Damico Patrick H | $20,000 | |
| Previous Owner | Damico Patrick H | $204,500 | |
| Previous Owner | Damico Patrick H | $205,200 |
Source: Public Records
Tax History Compared to Growth
Tax History
| Year | Tax Paid | Tax Assessment Tax Assessment Total Assessment is a certain percentage of the fair market value that is determined by local assessors to be the total taxable value of land and additions on the property. | Land | Improvement |
|---|---|---|---|---|
| 2025 | $9,856 | $748,400 | $279,800 | $468,600 |
| 2024 | $9,789 | $725,100 | $291,900 | $433,200 |
| 2023 | $9,446 | $670,400 | $291,900 | $378,500 |
| 2022 | $9,073 | $598,100 | $270,200 | $327,900 |
| 2021 | $8,829 | $574,800 | $225,300 | $349,500 |
| 2020 | $8,688 | $565,600 | $225,300 | $340,300 |
| 2019 | $8,080 | $530,900 | $187,600 | $343,300 |
| 2018 | $8,037 | $516,200 | $179,000 | $337,200 |
| 2017 | $7,537 | $501,800 | $173,900 | $327,900 |
| 2016 | $6,965 | $452,000 | $165,500 | $286,500 |
| 2015 | $6,780 | $437,400 | $165,500 | $271,900 |
Source: Public Records
Map
Nearby Homes
- 24 Maverick Dr
- 150 Gilbert St
- 4 Buckskin Dr
- 116 George St
- 11 Landry Ave
- 196 Donald Tennant Cir
- 255 Mckeon Dr
- 16 Treasure Island Rd
- 406 South St
- 5 Old Wood Rd
- 15 Old Wood Rd
- 115 Westfield Dr
- 57 Vine St
- 28 Messenger St
- 9 Oak Dr
- 176 Elm St
- 11 Buckthorn Ln
- Lot 5 Jeffrey Dr
- 9 Sunnyside Dr Unit 9
- Lot 2 Jeffrey Dr