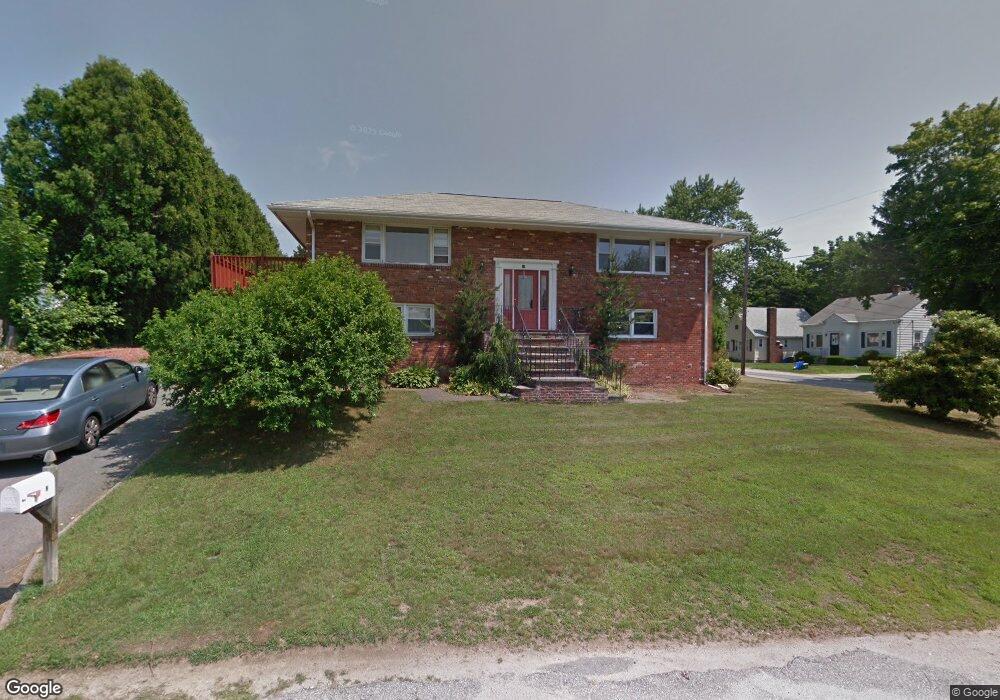
11 White Dr Johnston, RI 02919
Hartford Avenue NeighborhoodEstimated Value: $451,000 - $526,000
4
Beds
2
Baths
2,544
Sq Ft
$189/Sq Ft
Est. Value
About This Home
This home is located at 11 White Dr, Johnston, RI 02919 and is currently estimated at $482,020, approximately $189 per square foot. 11 White Dr is a home located in Providence County with nearby schools including Johnston Senior High School, Achievement First Promesa, and Achievement First Providence Mayoral Academy Elementary.
Ownership History
Date
Name
Owned For
Owner Type
Purchase Details
Closed on
Nov 5, 2008
Sold by
4Th Southstar
Bought by
Oneil Judith M
Current Estimated Value
Purchase Details
Closed on
Aug 14, 2008
Sold by
Yee Renato
Bought by
South Point Inc
Purchase Details
Closed on
Jun 1, 2004
Sold by
Berthiaume Allan R and Berthiaume Debra J
Bought by
Yee Renato and Yee Ruth
Create a Home Valuation Report for This Property
The Home Valuation Report is an in-depth analysis detailing your home's value as well as a comparison with similar homes in the area
Home Values in the Area
Average Home Value in this Area
Purchase History
| Date | Buyer | Sale Price | Title Company |
|---|---|---|---|
| Oneil Judith M | $190,000 | -- | |
| South Point Inc | $205,302 | -- | |
| Yee Renato | $240,000 | -- | |
| Oneil Judith M | $190,000 | -- | |
| South Point Inc | $205,302 | -- | |
| Yee Renato | $240,000 | -- |
Source: Public Records
Mortgage History
| Date | Status | Borrower | Loan Amount |
|---|---|---|---|
| Open | Yee Renato | $51,933 | |
| Open | Yee Renato | $175,917 |
Source: Public Records
Tax History
| Year | Tax Paid | Tax Assessment Tax Assessment Total Assessment is a certain percentage of the fair market value that is determined by local assessors to be the total taxable value of land and additions on the property. | Land | Improvement |
|---|---|---|---|---|
| 2025 | $5,828 | $373,100 | $86,800 | $286,300 |
| 2024 | $5,708 | $373,100 | $86,800 | $286,300 |
| 2023 | $5,708 | $373,100 | $86,800 | $286,300 |
| 2022 | $4,503 | $242,200 | $64,300 | $177,900 |
| 2021 | $5,629 | $242,200 | $64,300 | $177,900 |
| 2018 | $5,996 | $218,100 | $47,900 | $170,200 |
| 2016 | $7,932 | $218,100 | $47,900 | $170,200 |
| 2015 | $5,494 | $189,500 | $48,400 | $141,100 |
| 2014 | $4,359 | $189,500 | $48,400 | $141,100 |
| 2013 | $5,448 | $189,500 | $48,400 | $141,100 |
Source: Public Records
Map
Nearby Homes
- 24 Wilson Ave
- 1143 Hartford Ave Unit 4C
- 1141 Hartford Ave
- 0 Atwood Ave
- 0 Eagle St
- 56 N Olney St
- 19 S Long St
- 32 Harrington Dr
- 33 Harding Ave
- 0 Orchard St Unit 1396400
- 0 Orchard St Unit 1400488
- 1189 Atwood Ave
- 317 Morgan Ave
- 46 Auburn Ave
- 10 Mott St
- 23 Columbus Ave
- 587 Central Ave
- 91 Clifton St
- 16 Homestead Ave
- 30 S Bennett Dr
Your Personal Tour Guide
Ask me questions while you tour the home.