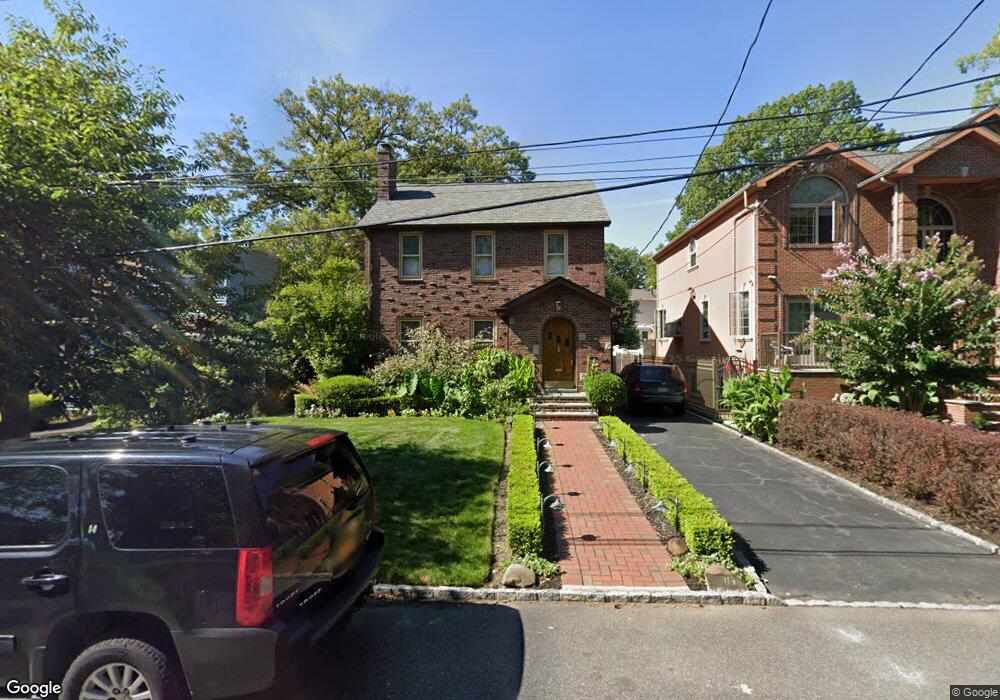
11 Whitehall St Staten Island, NY 10306
Oakwood NeighborhoodEstimated Value: $784,499 - $1,025,000
--
Bed
4
Baths
1,970
Sq Ft
$465/Sq Ft
Est. Value
About This Home
This home is located at 11 Whitehall St, Staten Island, NY 10306 and is currently estimated at $916,875, approximately $465 per square foot. 11 Whitehall St is a home located in Richmond County with nearby schools including P.S. 50 Frank Hankinson School, Myra S. Barnes Intermediate School 24, and New Dorp High School.
Ownership History
Date
Name
Owned For
Owner Type
Purchase Details
Closed on
Sep 29, 2003
Sold by
Dagostino Sabrina
Bought by
Belmonte John
Current Estimated Value
Home Financials for this Owner
Home Financials are based on the most recent Mortgage that was taken out on this home.
Original Mortgage
$275,000
Interest Rate
6.35%
Mortgage Type
Purchase Money Mortgage
Purchase Details
Closed on
Dec 15, 2000
Sold by
Valouch James R and Dagostino Sabrina
Bought by
Dagostino Sabrina
Purchase Details
Closed on
Aug 26, 1997
Sold by
Curry James and Curry Rose
Bought by
Valouch James R and Dagostino Sabrina
Home Financials for this Owner
Home Financials are based on the most recent Mortgage that was taken out on this home.
Original Mortgage
$186,000
Interest Rate
7.31%
Create a Home Valuation Report for This Property
The Home Valuation Report is an in-depth analysis detailing your home's value as well as a comparison with similar homes in the area
Home Values in the Area
Average Home Value in this Area
Purchase History
| Date | Buyer | Sale Price | Title Company |
|---|---|---|---|
| Belmonte John | $499,999 | -- | |
| Dagostino Sabrina | $40,500 | Chicago Title Insurance Co | |
| Valouch James R | $232,500 | -- |
Source: Public Records
Mortgage History
| Date | Status | Borrower | Loan Amount |
|---|---|---|---|
| Previous Owner | Belmonte John | $275,000 | |
| Previous Owner | Valouch James R | $186,000 |
Source: Public Records
Tax History Compared to Growth
Tax History
| Year | Tax Paid | Tax Assessment Tax Assessment Total Assessment is a certain percentage of the fair market value that is determined by local assessors to be the total taxable value of land and additions on the property. | Land | Improvement |
|---|---|---|---|---|
| 2025 | $8,158 | $46,980 | $13,896 | $33,084 |
| 2024 | $8,170 | $50,160 | $12,917 | $37,243 |
| 2023 | $7,766 | $39,640 | $10,374 | $29,266 |
| 2022 | $7,179 | $52,020 | $15,420 | $36,600 |
| 2021 | $7,122 | $43,080 | $15,420 | $27,660 |
| 2020 | $7,185 | $43,560 | $15,420 | $28,140 |
| 2019 | $7,032 | $41,700 | $15,420 | $26,280 |
| 2018 | $6,436 | $33,033 | $13,041 | $19,992 |
| 2017 | $6,053 | $31,164 | $12,228 | $18,936 |
| 2016 | $5,567 | $29,400 | $15,420 | $13,980 |
| 2015 | $5,637 | $32,821 | $13,197 | $19,624 |
| 2014 | $5,637 | $30,964 | $10,580 | $20,384 |
Source: Public Records
Map
Nearby Homes