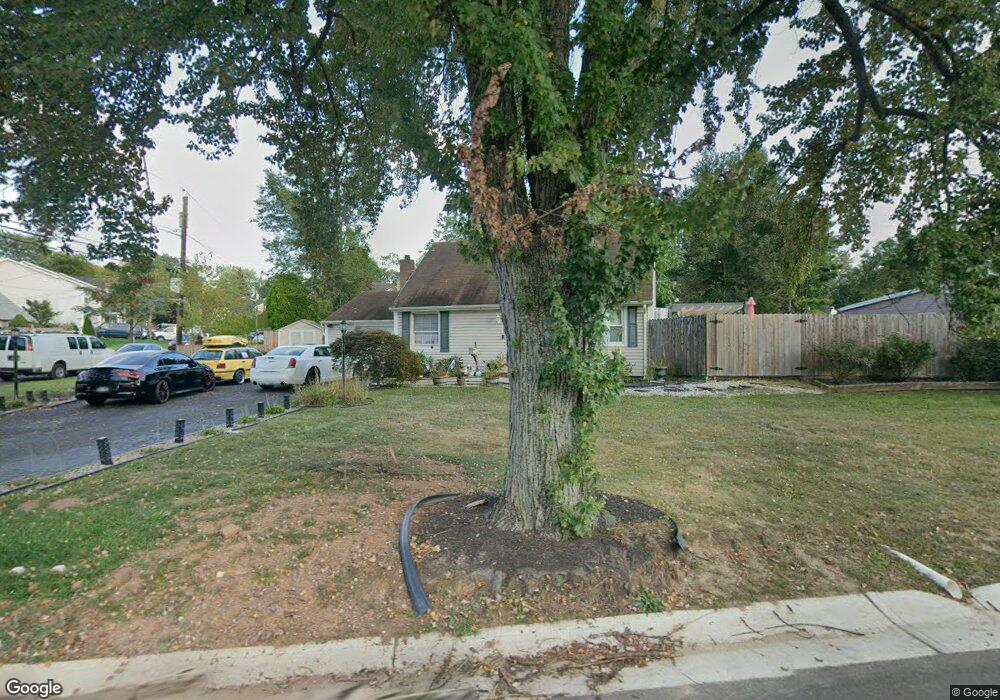
11 Wilcox Rd New Brunswick, NJ 08901
Estimated Value: $444,000 - $494,000
4
Beds
2
Baths
1,075
Sq Ft
$433/Sq Ft
Est. Value
About This Home
This home is located at 11 Wilcox Rd, New Brunswick, NJ 08901 and is currently estimated at $465,802, approximately $433 per square foot. 11 Wilcox Rd is a home located in Middlesex County with nearby schools including New Brunswick High School.
Ownership History
Date
Name
Owned For
Owner Type
Purchase Details
Closed on
May 14, 2013
Sold by
Lorber Laura M and Maiullo David
Bought by
Leka Afrim and Leka Gina
Current Estimated Value
Home Financials for this Owner
Home Financials are based on the most recent Mortgage that was taken out on this home.
Original Mortgage
$216,505
Outstanding Balance
$155,263
Interest Rate
3.75%
Mortgage Type
FHA
Estimated Equity
$310,539
Purchase Details
Closed on
Sep 4, 2003
Sold by
Lachowicz Edyta
Bought by
Maiullo David and Lorber Laura
Home Financials for this Owner
Home Financials are based on the most recent Mortgage that was taken out on this home.
Original Mortgage
$203,600
Interest Rate
6.15%
Purchase Details
Closed on
Jan 28, 1994
Sold by
Johnson Peter
Bought by
Lachowicz Edyta
Home Financials for this Owner
Home Financials are based on the most recent Mortgage that was taken out on this home.
Original Mortgage
$103,000
Interest Rate
7.12%
Create a Home Valuation Report for This Property
The Home Valuation Report is an in-depth analysis detailing your home's value as well as a comparison with similar homes in the area
Home Values in the Area
Average Home Value in this Area
Purchase History
| Date | Buyer | Sale Price | Title Company |
|---|---|---|---|
| Leka Afrim | $220,500 | First American Title Ins Cos | |
| Maiullo David | $254,500 | -- | |
| Lachowicz Edyta | $123,000 | -- |
Source: Public Records
Mortgage History
| Date | Status | Borrower | Loan Amount |
|---|---|---|---|
| Open | Leka Afrim | $216,505 | |
| Previous Owner | Maiullo David | $203,600 | |
| Previous Owner | Lachowicz Edyta | $103,000 |
Source: Public Records
Tax History Compared to Growth
Tax History
| Year | Tax Paid | Tax Assessment Tax Assessment Total Assessment is a certain percentage of the fair market value that is determined by local assessors to be the total taxable value of land and additions on the property. | Land | Improvement |
|---|---|---|---|---|
| 2025 | $5,709 | $218,000 | $142,000 | $76,000 |
| 2024 | $5,544 | $218,000 | $142,000 | $76,000 |
| 2023 | $5,544 | $218,000 | $142,000 | $76,000 |
| 2022 | $5,426 | $218,000 | $142,000 | $76,000 |
| 2021 | $4,025 | $218,000 | $142,000 | $76,000 |
| 2020 | $5,385 | $218,000 | $142,000 | $76,000 |
| 2019 | $5,282 | $218,000 | $142,000 | $76,000 |
| 2018 | $5,162 | $218,000 | $142,000 | $76,000 |
| 2017 | $4,957 | $218,000 | $142,000 | $76,000 |
| 2016 | $6,200 | $105,700 | $50,800 | $54,900 |
| 2015 | $6,052 | $105,700 | $50,800 | $54,900 |
| 2014 | $5,945 | $105,700 | $50,800 | $54,900 |
Source: Public Records
Map
Nearby Homes
- 63 Pennington Rd
- 104 S Pennington Rd
- 106 S Pennington Rd
- 88 Fox Rd Unit 4B
- 53 Patton Dr
- 11 Cotter Dr
- 66 Fox Rd Unit 9B
- 523 Sadie Cir
- 521 Sadie Cir
- 602 Sadie Cir
- 628 Sadie Cir
- 60 Fox Rd
- 513 Sadie Cir
- 509 Sadie Cir
- 37 York Dr Unit 6A
- 220 Jessie Place
- 228 Jessie Place
- 15 York Dr Unit 1B
- 31 York Dr Unit 3A
- 500 Grove Ave