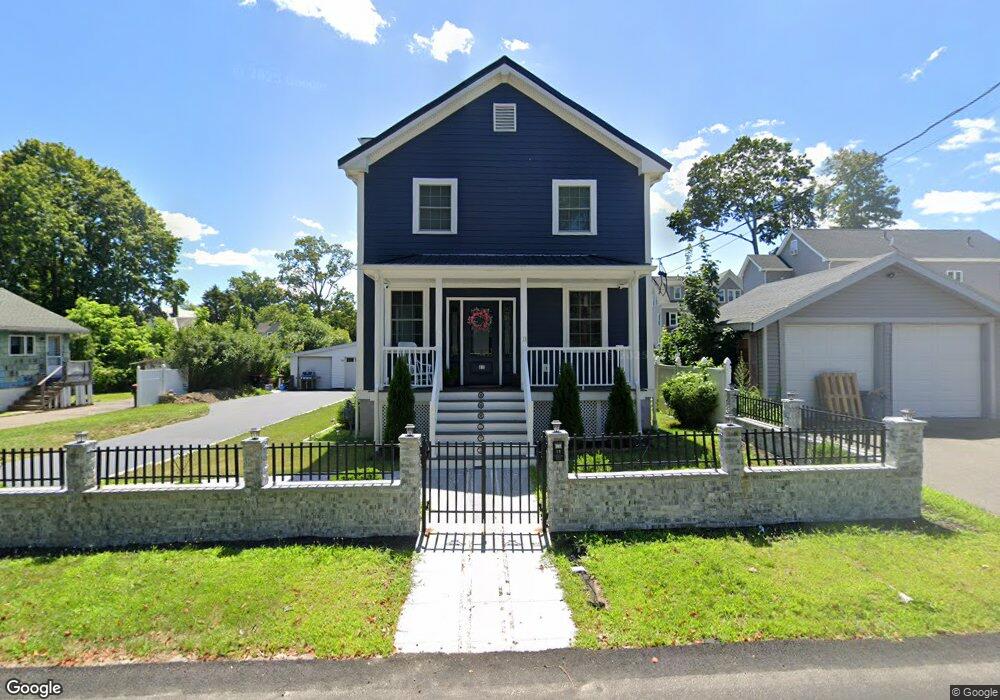
11 Wilder St Brockton, MA 02301
Montello NeighborhoodEstimated Value: $427,000 - $573,000
2
Beds
1
Bath
782
Sq Ft
$647/Sq Ft
Est. Value
About This Home
This home is located at 11 Wilder St, Brockton, MA 02301 and is currently estimated at $506,134, approximately $647 per square foot. 11 Wilder St is a home located in Plymouth County with nearby schools including Raymond K-8 Elementary School, Louis F Angelo Elementary School, and Manthala George Jr. School.
Ownership History
Date
Name
Owned For
Owner Type
Purchase Details
Closed on
Aug 30, 2006
Sold by
Davenport Olive S
Bought by
Spinal Nelson and Peralta Ingrid
Current Estimated Value
Home Financials for this Owner
Home Financials are based on the most recent Mortgage that was taken out on this home.
Original Mortgage
$167,200
Outstanding Balance
$101,282
Interest Rate
6.83%
Mortgage Type
Purchase Money Mortgage
Estimated Equity
$404,852
Purchase Details
Closed on
May 6, 2004
Sold by
Joseph A Lucier and Joseph Bern
Bought by
Wilder Street Nt
Create a Home Valuation Report for This Property
The Home Valuation Report is an in-depth analysis detailing your home's value as well as a comparison with similar homes in the area
Home Values in the Area
Average Home Value in this Area
Purchase History
| Date | Buyer | Sale Price | Title Company |
|---|---|---|---|
| Spinal Nelson | $210,000 | -- | |
| Wilder Street Nt | $230,000 | -- |
Source: Public Records
Mortgage History
| Date | Status | Borrower | Loan Amount |
|---|---|---|---|
| Open | Wilder Street Nt | $167,200 | |
| Closed | Wilder Street Nt | $41,800 |
Source: Public Records
Tax History Compared to Growth
Tax History
| Year | Tax Paid | Tax Assessment Tax Assessment Total Assessment is a certain percentage of the fair market value that is determined by local assessors to be the total taxable value of land and additions on the property. | Land | Improvement |
|---|---|---|---|---|
| 2025 | $5,732 | $473,300 | $144,800 | $328,500 |
| 2024 | $5,403 | $449,500 | $144,800 | $304,700 |
| 2023 | $5,583 | $430,100 | $109,700 | $320,400 |
| 2022 | $4,663 | $333,800 | $99,700 | $234,100 |
| 2021 | $3,418 | $235,700 | $94,200 | $141,500 |
| 2020 | $3,425 | $226,100 | $90,300 | $135,800 |
| 2019 | $3,072 | $197,700 | $84,500 | $113,200 |
| 2018 | $2,812 | $175,100 | $84,500 | $90,600 |
| 2017 | $2,550 | $158,400 | $84,500 | $73,900 |
| 2016 | $2,503 | $144,200 | $76,500 | $67,700 |
| 2015 | $2,258 | $124,400 | $76,500 | $47,900 |
| 2014 | $2,177 | $120,100 | $76,500 | $43,600 |
Source: Public Records
Map
Nearby Homes