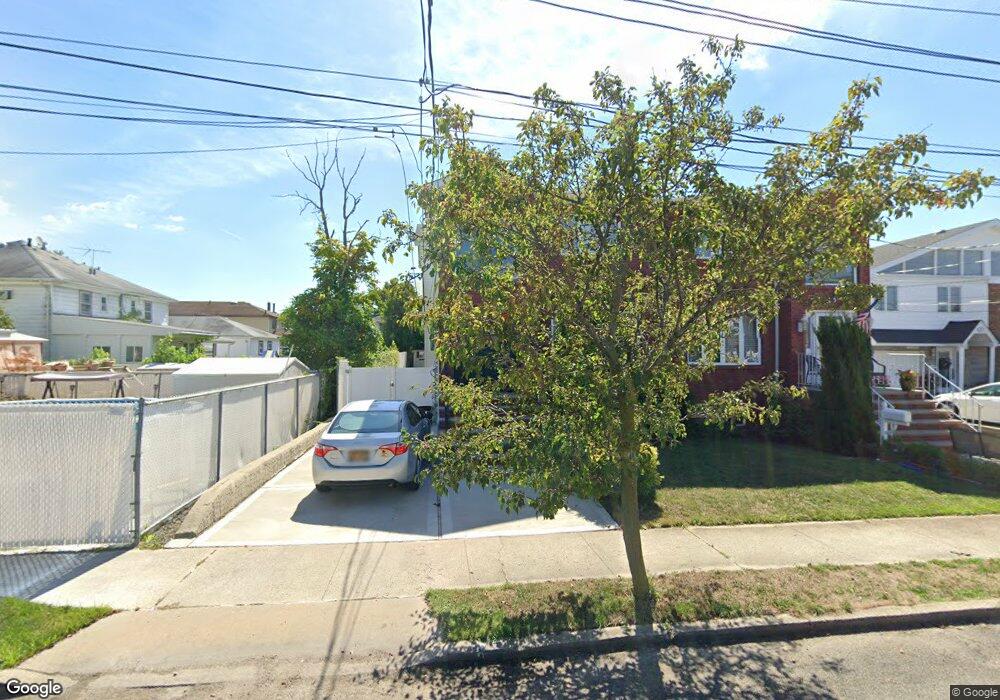
11 Wiley Place Staten Island, NY 10306
Oakwood NeighborhoodEstimated Value: $931,730 - $1,007,000
4
Beds
4
Baths
3,000
Sq Ft
$325/Sq Ft
Est. Value
About This Home
This home is located at 11 Wiley Place, Staten Island, NY 10306 and is currently estimated at $974,933, approximately $324 per square foot. 11 Wiley Place is a home located in Richmond County with nearby schools including P.S. 23 Richmondtown, Myra S. Barnes Intermediate School 24, and New Dorp High School.
Ownership History
Date
Name
Owned For
Owner Type
Purchase Details
Closed on
May 5, 2022
Sold by
Eugene Serebro
Bought by
Eugene Serebro F and Eugene K
Current Estimated Value
Purchase Details
Closed on
Feb 25, 2011
Sold by
Colella Donna A
Bought by
Serebro Eugene and Serebro Yevgeniy
Home Financials for this Owner
Home Financials are based on the most recent Mortgage that was taken out on this home.
Original Mortgage
$335,000
Interest Rate
4.83%
Mortgage Type
New Conventional
Purchase Details
Closed on
Feb 22, 2005
Sold by
Primary Construction Corp
Bought by
Colella Donna A
Home Financials for this Owner
Home Financials are based on the most recent Mortgage that was taken out on this home.
Original Mortgage
$250,000
Interest Rate
5.87%
Mortgage Type
Fannie Mae Freddie Mac
Create a Home Valuation Report for This Property
The Home Valuation Report is an in-depth analysis detailing your home's value as well as a comparison with similar homes in the area
Home Values in the Area
Average Home Value in this Area
Purchase History
| Date | Buyer | Sale Price | Title Company |
|---|---|---|---|
| Eugene Serebro F | -- | None Listed On Document | |
| Serebro Eugene | $575,000 | The Judicial Title Insurance | |
| Colella Donna A | $640,479 | -- |
Source: Public Records
Mortgage History
| Date | Status | Borrower | Loan Amount |
|---|---|---|---|
| Previous Owner | Serebro Eugene | $335,000 | |
| Previous Owner | Colella Donna A | $250,000 |
Source: Public Records
Tax History Compared to Growth
Tax History
| Year | Tax Paid | Tax Assessment Tax Assessment Total Assessment is a certain percentage of the fair market value that is determined by local assessors to be the total taxable value of land and additions on the property. | Land | Improvement |
|---|---|---|---|---|
| 2025 | $7,832 | $48,720 | $11,073 | $37,647 |
| 2024 | $7,844 | $43,800 | $11,620 | $32,180 |
| 2023 | $7,919 | $40,392 | $10,670 | $29,722 |
| 2022 | $7,716 | $45,240 | $12,600 | $32,640 |
| 2021 | $7,656 | $38,280 | $12,600 | $25,680 |
| 2020 | $7,256 | $38,700 | $12,600 | $26,100 |
| 2019 | $6,748 | $33,660 | $12,600 | $21,060 |
| 2018 | $6,588 | $33,780 | $12,600 | $21,180 |
| 2017 | $6,999 | $35,806 | $12,532 | $23,274 |
| 2016 | $6,443 | $33,780 | $12,600 | $21,180 |
| 2015 | $6,249 | $36,202 | $11,511 | $24,691 |
| 2014 | $6,249 | $34,153 | $11,962 | $22,191 |
Source: Public Records
Map
Nearby Homes
- 194 Tysens Ln
- 32 Mobile Ave
- 2889 Amboy Rd
- 305 Tysens Ln Unit B
- 87 Vincent Ave
- 4 Penn Ave
- 126 Tysens Ln
- 20 Francine Ct Unit A
- 30 Wolverine St
- 32 Francine Ct Unit B
- 52 Farrell Ct
- 52 Francine Ct Unit A
- 52A Francine Ct Unit 80A
- 56 Wolverine St
- 39 Thomas St
- 351 8th St
- 44 Thomas St
- 86 Cedarview Ave
- 96 Dale Ave
- 50 Hitchcock Ave