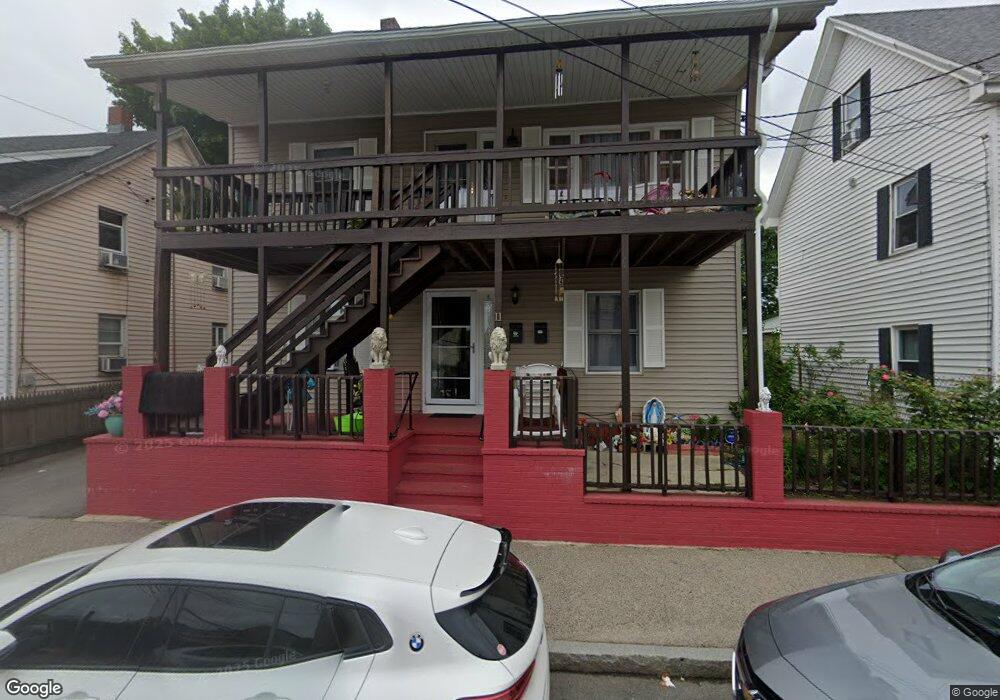
11 Wilton St Hyde Park, MA 02136
Hyde Park NeighborhoodEstimated Value: $821,182 - $928,000
6
Beds
2
Baths
2,680
Sq Ft
$319/Sq Ft
Est. Value
About This Home
This home is located at 11 Wilton St, Hyde Park, MA 02136 and is currently estimated at $855,046, approximately $319 per square foot. 11 Wilton St is a home located in Suffolk County with nearby schools including Boston Renaissance Charter Public School and New Beginnings Academy.
Ownership History
Date
Name
Owned For
Owner Type
Purchase Details
Closed on
Feb 27, 2021
Sold by
Corzo Mario H and Corzo Georgina
Bought by
Corzo Ft
Current Estimated Value
Purchase Details
Closed on
Jul 29, 1994
Sold by
Musto Angelo and Corzo Mario H
Bought by
Corzo Mario H and Corzo Georgina
Home Financials for this Owner
Home Financials are based on the most recent Mortgage that was taken out on this home.
Original Mortgage
$140,100
Interest Rate
8.25%
Mortgage Type
Purchase Money Mortgage
Purchase Details
Closed on
Apr 29, 1994
Sold by
Roslindale Coop Bk
Bought by
Musto Angelo
Home Financials for this Owner
Home Financials are based on the most recent Mortgage that was taken out on this home.
Original Mortgage
$110,000
Interest Rate
7.7%
Mortgage Type
Purchase Money Mortgage
Purchase Details
Closed on
Jul 27, 1993
Sold by
Maddestra Joseph and Roslindale Coop Bk
Bought by
Roslindale Co-Op Bk
Create a Home Valuation Report for This Property
The Home Valuation Report is an in-depth analysis detailing your home's value as well as a comparison with similar homes in the area
Home Values in the Area
Average Home Value in this Area
Purchase History
| Date | Buyer | Sale Price | Title Company |
|---|---|---|---|
| Corzo Ft | -- | None Available | |
| Corzo Mario H | $147,500 | -- | |
| Musto Angelo | $75,000 | -- | |
| Roslindale Co-Op Bk | $72,600 | -- |
Source: Public Records
Mortgage History
| Date | Status | Borrower | Loan Amount |
|---|---|---|---|
| Previous Owner | Corzo Mario H | $140,100 | |
| Previous Owner | Musto Angelo | $110,000 | |
| Previous Owner | Roslindale Co-Op Bk | $70,000 | |
| Previous Owner | Roslindale Co-Op Bk | $10,000 |
Source: Public Records
Tax History Compared to Growth
Tax History
| Year | Tax Paid | Tax Assessment Tax Assessment Total Assessment is a certain percentage of the fair market value that is determined by local assessors to be the total taxable value of land and additions on the property. | Land | Improvement |
|---|---|---|---|---|
| 2025 | $8,046 | $694,800 | $197,400 | $497,400 |
| 2024 | $6,960 | $638,500 | $241,600 | $396,900 |
| 2023 | $6,123 | $570,100 | $215,700 | $354,400 |
| 2022 | $5,742 | $527,800 | $199,700 | $328,100 |
| 2021 | $5,521 | $517,400 | $195,800 | $321,600 |
| 2020 | $5,093 | $482,300 | $163,000 | $319,300 |
| 2019 | $4,985 | $473,000 | $121,500 | $351,500 |
| 2018 | $4,505 | $429,900 | $121,500 | $308,400 |
| 2017 | $4,336 | $409,400 | $121,500 | $287,900 |
| 2016 | $3,951 | $359,200 | $121,500 | $237,700 |
| 2015 | $4,625 | $381,900 | $109,800 | $272,100 |
| 2014 | $4,243 | $337,300 | $109,800 | $227,500 |
Source: Public Records
Map
Nearby Homes
- 1442 Hyde Park Ave Unit 1442
- 14 Dacy St Unit 12
- 1491 Hyde Park Ave
- 14 Winter St
- 15 Madison St
- 1505 Hyde Park Ave
- 35 Garfield Ave
- 116 Dana Ave
- 755-759 Truman Pkwy
- 79 Maple St Unit 3
- 715 Truman Pkwy
- 10 Van Brunt St
- 0 Truman Pkwy
- 87 Sunnyside St Unit 87
- 43 Thompson St
- 148 Beaver St
- 39 Badger Rd
- 69 Readville St Unit B
- 69 Readville St Unit A
- 71 Readville St Unit B
- 9 Wilton St
- 9 Wilton St Unit 1
- 9 Wilton St Unit 2
- 13 Wilton St Unit 15
- 15 Wilton St
- 17 Wilton St
- 1450-1456 Hyde Park Ave
- 40 Glenwood Ave
- 12 Wilton St
- 10 Wilton St
- 6 Wilton St
- 6 Wilton St Unit 6
- 6 Wilton St Unit 10
- 48 Glenwood Ave
- 19 Wilton St
- 4 Wilton St
- 4 Wilton St Unit 9
- 52 Glenwood Ave
- 21 Wilton St
- 1446 Hyde Park Ave Unit 8