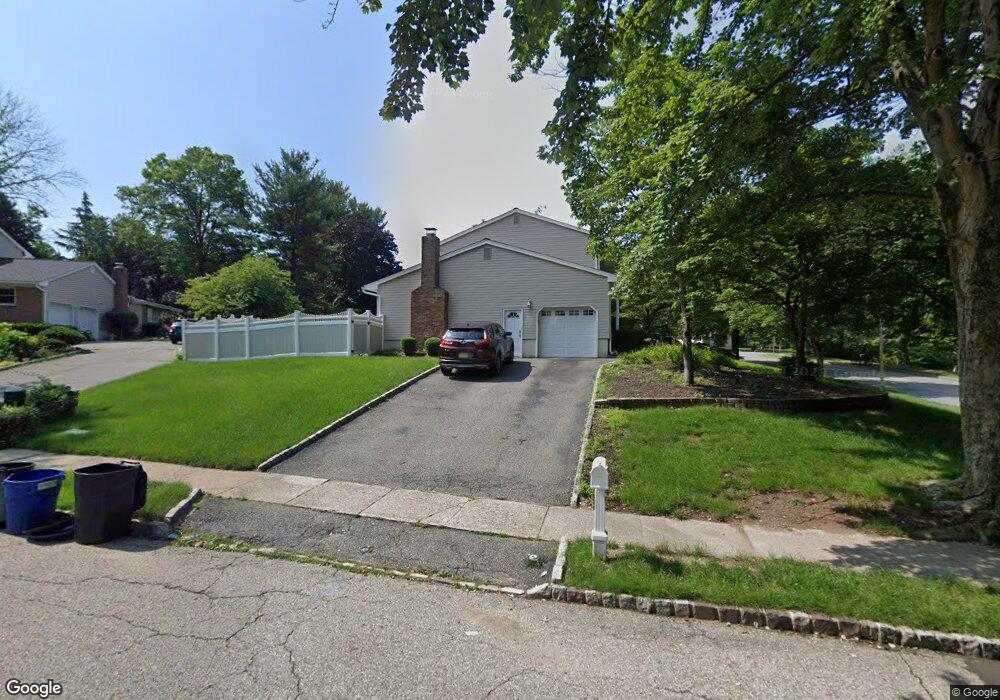
11 Winding Way Parsippany, NJ 07054
Estimated Value: $801,277 - $888,000
--
Bed
--
Bath
2,536
Sq Ft
$335/Sq Ft
Est. Value
About This Home
This home is located at 11 Winding Way, Parsippany, NJ 07054 and is currently estimated at $849,819, approximately $335 per square foot. 11 Winding Way is a home located in Morris County with nearby schools including Intervale Elementary School, Brooklawn Middle School, and Parsippany Hills High School.
Ownership History
Date
Name
Owned For
Owner Type
Purchase Details
Closed on
May 2, 2018
Sold by
Becher Eric and Reilly Lisa
Bought by
Reilly Lisa A
Current Estimated Value
Purchase Details
Closed on
Jun 24, 2003
Sold by
Black Thomas
Bought by
Becher Eric and Reilly Lisa
Home Financials for this Owner
Home Financials are based on the most recent Mortgage that was taken out on this home.
Original Mortgage
$322,700
Interest Rate
5.46%
Create a Home Valuation Report for This Property
The Home Valuation Report is an in-depth analysis detailing your home's value as well as a comparison with similar homes in the area
Home Values in the Area
Average Home Value in this Area
Purchase History
| Date | Buyer | Sale Price | Title Company |
|---|---|---|---|
| Reilly Lisa A | $406,571 | None Available | |
| Becher Eric | $460,000 | -- |
Source: Public Records
Mortgage History
| Date | Status | Borrower | Loan Amount |
|---|---|---|---|
| Previous Owner | Becher Eric | $322,700 |
Source: Public Records
Tax History Compared to Growth
Tax History
| Year | Tax Paid | Tax Assessment Tax Assessment Total Assessment is a certain percentage of the fair market value that is determined by local assessors to be the total taxable value of land and additions on the property. | Land | Improvement |
|---|---|---|---|---|
| 2025 | $14,864 | $435,900 | $218,400 | $217,500 |
| 2024 | $14,590 | $435,900 | $218,400 | $217,500 |
| 2023 | $14,590 | $435,900 | $218,400 | $217,500 |
| 2022 | $13,639 | $435,900 | $218,400 | $217,500 |
| 2021 | $13,639 | $435,900 | $218,400 | $217,500 |
| 2020 | $13,347 | $435,900 | $218,400 | $217,500 |
| 2019 | $12,985 | $435,900 | $218,400 | $217,500 |
| 2018 | $12,698 | $435,900 | $218,400 | $217,500 |
| 2017 | $12,406 | $435,900 | $218,400 | $217,500 |
| 2016 | $12,183 | $435,900 | $218,400 | $217,500 |
| 2015 | $11,874 | $435,900 | $218,400 | $217,500 |
| 2014 | $11,713 | $435,900 | $218,400 | $217,500 |
Source: Public Records
Map
Nearby Homes
- 15 Glen Rd
- 3 Maple Way
- 8 Craven Rd
- 38 Robinhood Dr
- 8 Sherwood Dr
- 71 Ball Rd
- 2 Albie Dr
- 6 Larchdell Way
- 3 Queen St
- 189 Littleton Rd Unit 41
- 150 Parsippany Blvd
- 260 Everett Rd
- 12 Overlook Rd
- 32 Hardwick Ct
- 17 Springview Dr
- 14 Willow Ln
- Rockefeller with Library Plan at Parq
- Rockefeller Plan at Parq
- 17 Crystal Rd
- 44 Hanover Rd