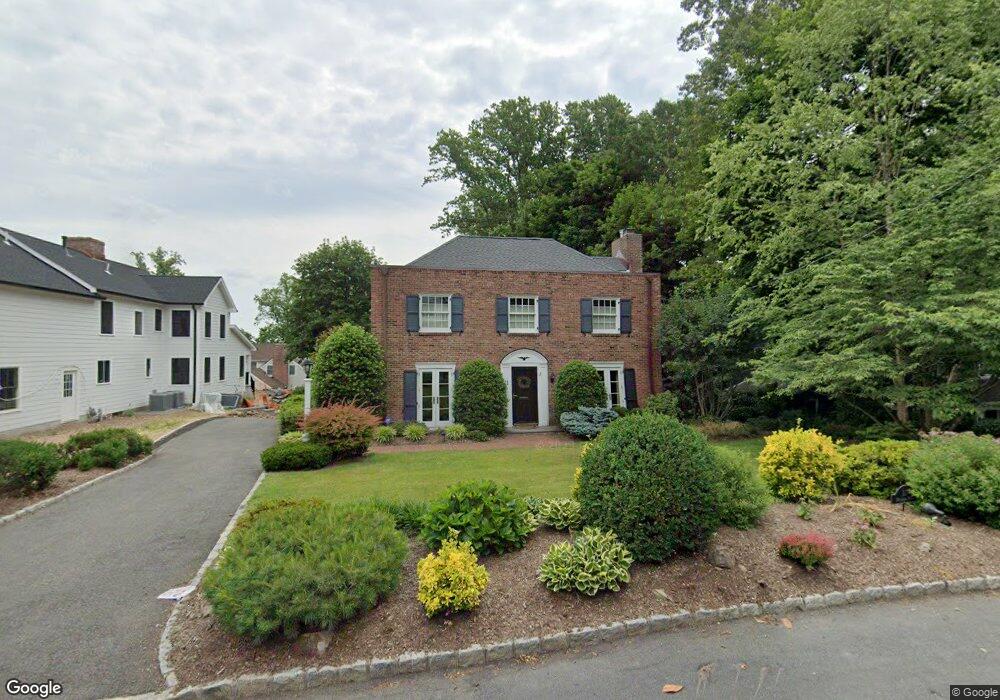
11 Windsor Rd Summit, NJ 07901
Estimated Value: $1,337,000 - $2,155,000
Studio
--
Bath
2,140
Sq Ft
$822/Sq Ft
Est. Value
About This Home
This home is located at 11 Windsor Rd, Summit, NJ 07901 and is currently estimated at $1,758,131, approximately $821 per square foot. 11 Windsor Rd is a home located in Union County with nearby schools including L C Johnson Summit Middle School, Summit Sr High School, and Oak Knoll School of the Holy Child.
Ownership History
Date
Name
Owned For
Owner Type
Purchase Details
Closed on
Jan 27, 2000
Sold by
Snedeker Thomas E and Snedeker Valerie
Bought by
Patterson Gerald W and Patterson Colleen M
Current Estimated Value
Home Financials for this Owner
Home Financials are based on the most recent Mortgage that was taken out on this home.
Original Mortgage
$431,200
Outstanding Balance
$129,112
Interest Rate
6.87%
Mortgage Type
Purchase Money Mortgage
Estimated Equity
$1,629,019
Create a Home Valuation Report for This Property
The Home Valuation Report is an in-depth analysis detailing your home's value as well as a comparison with similar homes in the area
Home Values in the Area
Average Home Value in this Area
Purchase History
| Date | Buyer | Sale Price | Title Company |
|---|---|---|---|
| Patterson Gerald W | $539,000 | Stewart Title Guaranty Compa |
Source: Public Records
Mortgage History
| Date | Status | Borrower | Loan Amount |
|---|---|---|---|
| Open | Patterson Gerald W | $431,200 |
Source: Public Records
Tax History
| Year | Tax Paid | Tax Assessment Tax Assessment Total Assessment is a certain percentage of the fair market value that is determined by local assessors to be the total taxable value of land and additions on the property. | Land | Improvement |
|---|---|---|---|---|
| 2025 | $21,758 | $499,500 | $277,400 | $222,100 |
| 2024 | $21,613 | $499,500 | $277,400 | $222,100 |
| 2023 | $21,613 | $499,500 | $277,400 | $222,100 |
| 2022 | $21,394 | $499,500 | $277,400 | $222,100 |
| 2021 | $21,563 | $499,500 | $277,400 | $222,100 |
| 2020 | $21,778 | $499,500 | $277,400 | $222,100 |
| 2019 | $21,803 | $499,500 | $277,400 | $222,100 |
| 2018 | $21,663 | $499,500 | $277,400 | $222,100 |
| 2017 | $21,803 | $499,500 | $277,400 | $222,100 |
| 2016 | $21,484 | $499,500 | $277,400 | $222,100 |
| 2015 | $21,064 | $499,500 | $277,400 | $222,100 |
| 2014 | $20,519 | $499,500 | $277,400 | $222,100 |
Source: Public Records
Map
Nearby Homes
- 709 Springfield Ave Unit One
- 709 Springfield Ave Unit 4
- 709 Springfield Ave Unit 2
- 709 Springfield Ave Unit 3
- 16 Little Wolf Rd
- 67 Tulip St
- 61 Tulip St
- 157 Grant Ave
- 20 Pittsford Way
- 40 Prospect St
- 17 Badgley Dr
- 62 Mountain Ave
- 68 New England Ave Unit 18
- 34 Ascot Way
- 34 Grant Ave
- 23 William St
- 110 Livingston Ave
- 1104 Sylvan Ln
- 50 Livingston Ave
- 11 Mount Vernon Ave
Your Personal Tour Guide
Ask me questions while you tour the home.