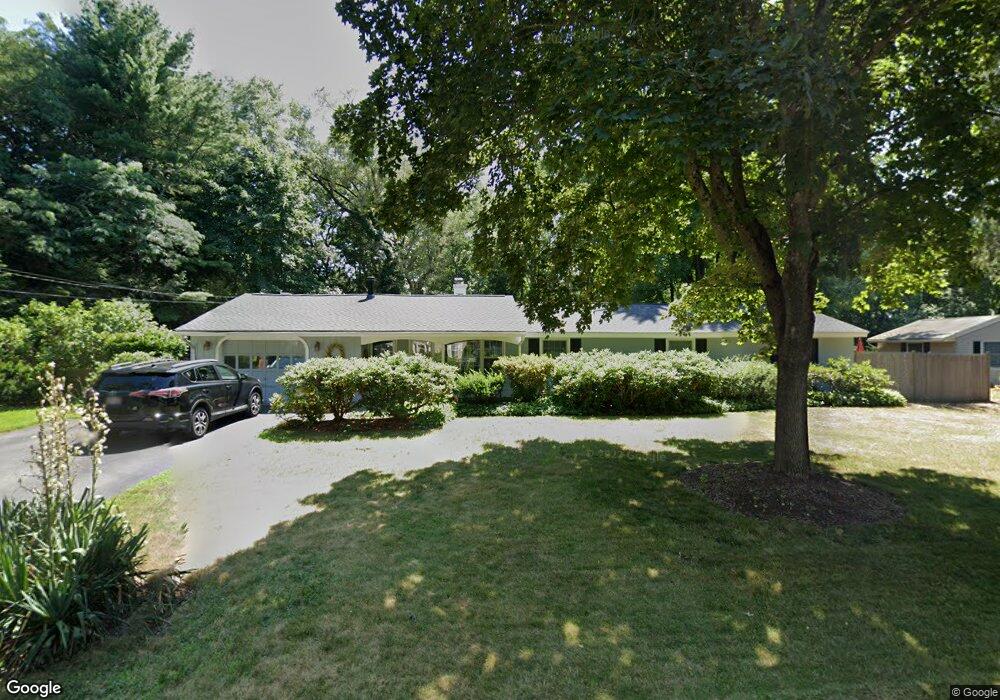
11 Winifred Rd Framingham, MA 01701
Nobscot NeighborhoodEstimated Value: $616,945 - $724,000
3
Beds
2
Baths
1,776
Sq Ft
$375/Sq Ft
Est. Value
About This Home
This home is located at 11 Winifred Rd, Framingham, MA 01701 and is currently estimated at $665,486, approximately $374 per square foot. 11 Winifred Rd is a home located in Middlesex County with nearby schools including Framingham High School, MetroWest Jewish Day School, and Summit Montessori School.
Ownership History
Date
Name
Owned For
Owner Type
Purchase Details
Closed on
Jun 29, 2022
Sold by
Lyons Kevin and Boccio Rhonda A
Bought by
Lyons Lt and Lyons
Current Estimated Value
Purchase Details
Closed on
Sep 16, 1997
Sold by
Stern Robert L and Stern Vanessa R
Bought by
Lyons Kevin and Boccio Rhonda A
Create a Home Valuation Report for This Property
The Home Valuation Report is an in-depth analysis detailing your home's value as well as a comparison with similar homes in the area
Home Values in the Area
Average Home Value in this Area
Purchase History
| Date | Buyer | Sale Price | Title Company |
|---|---|---|---|
| Lyons Lt | -- | None Available | |
| Lyons Lt | -- | None Available | |
| Lyons Kevin | $185,000 | -- | |
| Lyons Kevin | $185,000 | -- |
Source: Public Records
Mortgage History
| Date | Status | Borrower | Loan Amount |
|---|---|---|---|
| Previous Owner | Lyons Kevin | $175,000 | |
| Previous Owner | Lyons Kevin | $65,000 |
Source: Public Records
Tax History
| Year | Tax Paid | Tax Assessment Tax Assessment Total Assessment is a certain percentage of the fair market value that is determined by local assessors to be the total taxable value of land and additions on the property. | Land | Improvement |
|---|---|---|---|---|
| 2025 | $6,546 | $548,200 | $271,500 | $276,700 |
| 2024 | $6,397 | $513,400 | $242,500 | $270,900 |
| 2023 | $6,057 | $462,700 | $216,400 | $246,300 |
| 2022 | $5,760 | $419,200 | $196,400 | $222,800 |
| 2021 | $5,596 | $398,300 | $188,800 | $209,500 |
| 2020 | $5,618 | $375,000 | $171,500 | $203,500 |
| 2019 | $5,501 | $357,700 | $171,500 | $186,200 |
| 2018 | $5,373 | $329,200 | $165,100 | $164,100 |
| 2017 | $5,163 | $309,000 | $160,300 | $148,700 |
| 2016 | $5,038 | $289,900 | $160,300 | $129,600 |
| 2015 | $5,075 | $284,800 | $160,800 | $124,000 |
Source: Public Records
Map
Nearby Homes
Your Personal Tour Guide
Ask me questions while you tour the home.