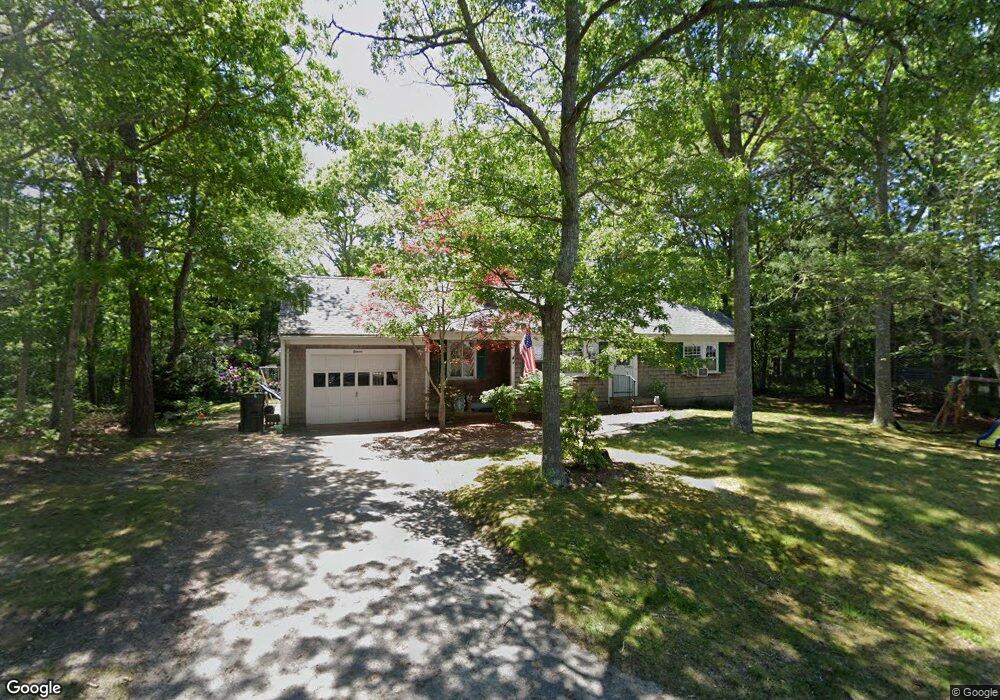
11 Zephyr Dr Yarmouth Port, MA 02675
Yarmouth Port NeighborhoodEstimated Value: $488,498 - $597,000
2
Beds
1
Bath
1,001
Sq Ft
$524/Sq Ft
Est. Value
About This Home
This home is located at 11 Zephyr Dr, Yarmouth Port, MA 02675 and is currently estimated at $524,625, approximately $524 per square foot. 11 Zephyr Dr is a home located in Barnstable County with nearby schools including Dennis-Yarmouth Regional High School, St. Pius X. School, and Trinity Christian Academy of Cape Cod.
Ownership History
Date
Name
Owned For
Owner Type
Purchase Details
Closed on
Dec 18, 2018
Sold by
Stratton Jane L Est and Hard
Bought by
Stratton Burton F and Stratton Patricia M
Current Estimated Value
Purchase Details
Closed on
Oct 24, 2018
Sold by
Stratton Jane L Est and Hard
Bought by
Hard Betsy J and Stratton Burton F
Purchase Details
Closed on
Jul 29, 1998
Sold by
Glivinski Richard S and Glivinski Tammy A
Bought by
Stratton Jane L
Purchase Details
Closed on
Mar 29, 1993
Sold by
Goucher Estella O and Goucher Arthur M
Bought by
Glivinski Richard S and Glivinski Tammy A
Home Financials for this Owner
Home Financials are based on the most recent Mortgage that was taken out on this home.
Original Mortgage
$95,650
Interest Rate
7.73%
Mortgage Type
Purchase Money Mortgage
Create a Home Valuation Report for This Property
The Home Valuation Report is an in-depth analysis detailing your home's value as well as a comparison with similar homes in the area
Home Values in the Area
Average Home Value in this Area
Purchase History
| Date | Buyer | Sale Price | Title Company |
|---|---|---|---|
| Stratton Burton F | -- | -- | |
| Hard Betsy J | -- | -- | |
| Stratton Jane L | $115,000 | -- | |
| Glivinski Richard S | $94,500 | -- |
Source: Public Records
Mortgage History
| Date | Status | Borrower | Loan Amount |
|---|---|---|---|
| Previous Owner | Glivinski Richard S | $95,650 |
Source: Public Records
Tax History Compared to Growth
Tax History
| Year | Tax Paid | Tax Assessment Tax Assessment Total Assessment is a certain percentage of the fair market value that is determined by local assessors to be the total taxable value of land and additions on the property. | Land | Improvement |
|---|---|---|---|---|
| 2025 | $2,894 | $408,800 | $140,500 | $268,300 |
| 2024 | $2,911 | $394,400 | $148,100 | $246,300 |
| 2023 | $2,839 | $350,000 | $132,000 | $218,000 |
| 2022 | $2,679 | $291,800 | $118,800 | $173,000 |
| 2021 | $2,533 | $265,000 | $118,800 | $146,200 |
| 2020 | $2,489 | $248,900 | $118,800 | $130,100 |
| 2019 | $2,319 | $229,600 | $118,800 | $110,800 |
| 2018 | $2,136 | $207,600 | $96,800 | $110,800 |
| 2017 | $2,080 | $207,600 | $96,800 | $110,800 |
| 2016 | $1,984 | $198,800 | $88,000 | $110,800 |
| 2015 | $2,029 | $202,100 | $88,000 | $114,100 |
Source: Public Records
Map
Nearby Homes
- 10 Balsam Way
- 50 Cottonwood St
- 34 Ridgewood Dr
- 882 W Yarmouth Rd
- 209 Union St
- 32 Deveau Ln
- 933-935 W Yarmouth Rd
- 607 W Yarmouth Rd
- 17 Trowbridge Path
- 560 W Yarmouth Rd
- 105 Old Hyannis Rd
- 371 Route 6a
- 24 Minnetuxet Way
- 8 Rowley Ln
- 111 Old Hyannis Rd
- 99 Old Hyannis Rd
- 16 Warren Rd Unit 16
- 16 Warren Rd
- 72 Quartermaster Row
- 62 Danas Path