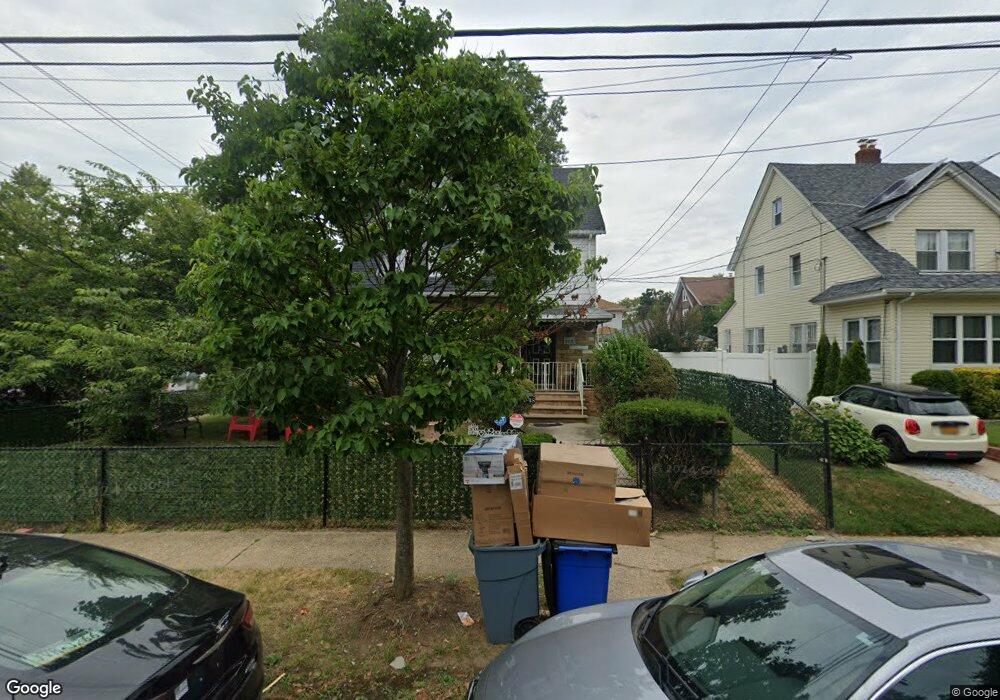
110-48 197th St Jamaica, NY 11412
Hollis NeighborhoodEstimated Value: $729,000 - $851,000
4
Beds
2
Baths
1,978
Sq Ft
$408/Sq Ft
Est. Value
About This Home
This home is located at 110-48 197th St, Jamaica, NY 11412 and is currently estimated at $807,573, approximately $408 per square foot. 110-48 197th St is a home located in Queens County with nearby schools including P.S. 118 Lorraine Hansberry, I.S. 192 The Linden, and Wellspring Elementary & Middle.
Ownership History
Date
Name
Owned For
Owner Type
Purchase Details
Closed on
Nov 14, 2018
Sold by
Zadeh Estates Llc
Bought by
Noor Sahzadi N and Shajahan Mohammed
Current Estimated Value
Purchase Details
Closed on
Feb 19, 2018
Sold by
Joseph N Misk Esq
Bought by
Zadeh Estates Llc
Purchase Details
Closed on
Apr 19, 2012
Sold by
Balcombe Abraham A
Bought by
Gaines Dawnyell
Home Financials for this Owner
Home Financials are based on the most recent Mortgage that was taken out on this home.
Original Mortgage
$348,450
Interest Rate
4.08%
Mortgage Type
New Conventional
Purchase Details
Closed on
Jan 20, 1995
Sold by
Jacobs Rose Anne
Bought by
Balcombe Abraham A and Balcombe Suzanne
Home Financials for this Owner
Home Financials are based on the most recent Mortgage that was taken out on this home.
Original Mortgage
$129,850
Interest Rate
9.19%
Mortgage Type
FHA
Create a Home Valuation Report for This Property
The Home Valuation Report is an in-depth analysis detailing your home's value as well as a comparison with similar homes in the area
Home Values in the Area
Average Home Value in this Area
Purchase History
| Date | Buyer | Sale Price | Title Company |
|---|---|---|---|
| Noor Sahzadi N | $605,000 | -- | |
| Zadeh Estates Llc | $380,250 | -- | |
| Gaines Dawnyell | $360,000 | -- | |
| Balcombe Abraham A | $130,000 | Chicago Title Insurance Co |
Source: Public Records
Mortgage History
| Date | Status | Borrower | Loan Amount |
|---|---|---|---|
| Previous Owner | Gaines Dawnyell | $348,450 | |
| Previous Owner | Balcombe Abraham A | $129,850 |
Source: Public Records
Tax History Compared to Growth
Tax History
| Year | Tax Paid | Tax Assessment Tax Assessment Total Assessment is a certain percentage of the fair market value that is determined by local assessors to be the total taxable value of land and additions on the property. | Land | Improvement |
|---|---|---|---|---|
| 2025 | $6,594 | $33,442 | $9,343 | $24,099 |
| 2024 | $4,886 | $32,832 | $10,655 | $22,177 |
| 2023 | $4,676 | $31,436 | $10,623 | $20,813 |
| 2022 | $5,602 | $32,700 | $13,260 | $19,440 |
| 2021 | $6,216 | $34,980 | $13,260 | $21,720 |
| 2020 | $5,899 | $33,060 | $13,260 | $19,800 |
| 2019 | $5,723 | $30,240 | $13,260 | $16,980 |
| 2018 | $5,340 | $26,197 | $10,584 | $15,613 |
| 2017 | $5,038 | $24,715 | $12,004 | $12,711 |
| 2016 | $4,921 | $24,715 | $12,004 | $12,711 |
| 2015 | $2,592 | $23,223 | $13,602 | $9,621 |
| 2014 | $2,592 | $22,800 | $14,760 | $8,040 |
Source: Public Records
Map
Nearby Homes
- 194- 24 111th Rd
- 194-29 112th Ave
- 11132 199th St
- 194-16 112th Ave
- 19404 110th Rd
- 190-63 112th Ave
- 112-28 199th St
- 190-59 112th Ave
- 191-40 112th Rd
- 19432 113th Rd
- 19920 Hollis Ave
- 19445 Murdock Ave
- 113-40 198th St
- 19022 111th Rd
- 19319 109th Rd
- 19427 Murdock Ave
- 193-21 109th Rd
- 194-56 Murdock Ave
- 194-42 Murdock Ave
- 200-21 Hollis Ave
- 11048 197th St
- 11048 197th St
- 11048 197 Square
- 11048 197th St
- 11044 197th St
- 11038 197th St
- 111-04 197th St
- 19605 111th Ave
- 11043 196th St
- 110-43 196th St
- 11034 197th St
- 11039 196th St
- 110-39 196th St
- 110-35 196th St
- 11035 196th St
- 19705 111th Ave
- 197-05 111th Ave
- 19614 111th Ave
- 11104 197th St
- 11041 197th St