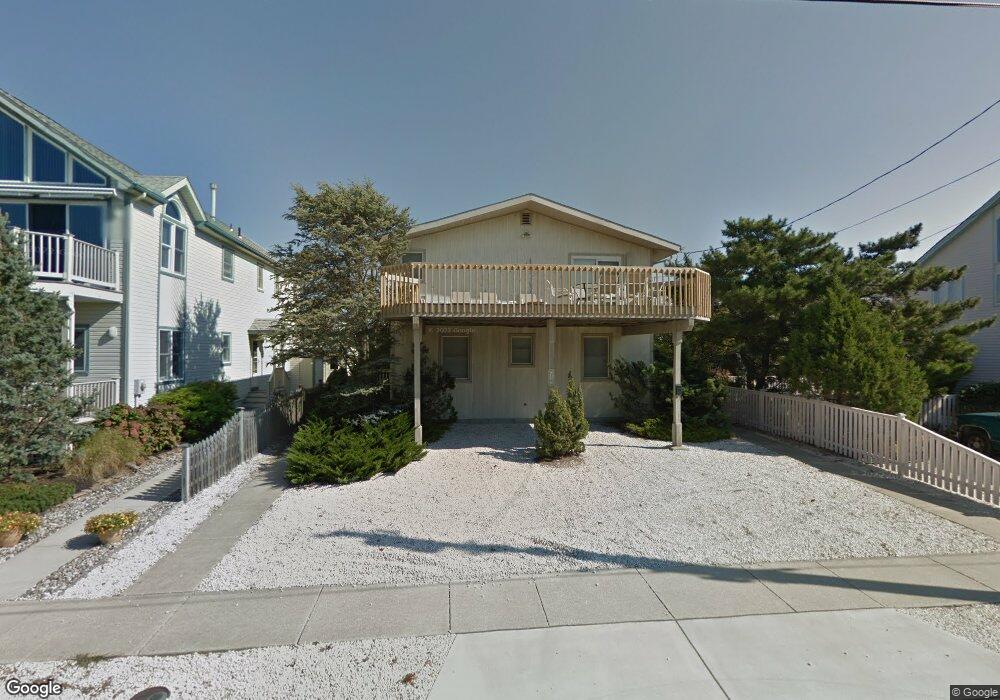
110 90th St Stone Harbor, NJ 08247
Estimated Value: $3,362,000 - $5,106,000
--
Bed
--
Bath
2,520
Sq Ft
$1,724/Sq Ft
Est. Value
About This Home
This home is located at 110 90th St, Stone Harbor, NJ 08247 and is currently estimated at $4,343,763, approximately $1,723 per square foot. 110 90th St is a home located in Cape May County with nearby schools including Stone Harbor Elementary School.
Ownership History
Date
Name
Owned For
Owner Type
Purchase Details
Closed on
Sep 27, 2019
Sold by
Roman Michael I
Bought by
Roman Michael I and Roman Kathleen M
Current Estimated Value
Purchase Details
Closed on
Aug 2, 2019
Sold by
Reman Barry A
Bought by
Roman Michael I
Purchase Details
Closed on
Jan 25, 2000
Purchase Details
Closed on
Jul 19, 1993
Sold by
Gehrke Larry D and Gehrke Joan C
Bought by
Resun Leasing Inc
Purchase Details
Closed on
Jan 19, 1990
Sold by
Double S Associates
Bought by
Gehrke Larry and Gehrke Joan
Create a Home Valuation Report for This Property
The Home Valuation Report is an in-depth analysis detailing your home's value as well as a comparison with similar homes in the area
Home Values in the Area
Average Home Value in this Area
Purchase History
| Date | Buyer | Sale Price | Title Company |
|---|---|---|---|
| Roman Michael I | -- | None Available | |
| Roman Michael I | $408,280 | -- | |
| -- | $442,900 | -- | |
| Resun Leasing Inc | $496,000 | -- | |
| Gehrke Larry | $440,000 | -- |
Source: Public Records
Tax History Compared to Growth
Tax History
| Year | Tax Paid | Tax Assessment Tax Assessment Total Assessment is a certain percentage of the fair market value that is determined by local assessors to be the total taxable value of land and additions on the property. | Land | Improvement |
|---|---|---|---|---|
| 2025 | $15,677 | $2,095,900 | $1,404,000 | $691,900 |
| 2024 | $15,677 | $2,095,900 | $1,404,000 | $691,900 |
| 2023 | $15,405 | $2,095,900 | $1,404,000 | $691,900 |
| 2022 | $14,504 | $2,095,900 | $1,404,000 | $691,900 |
| 2021 | $9,167 | $2,095,900 | $1,404,000 | $691,900 |
| 2020 | $8,564 | $1,404,000 | $1,404,000 | $0 |
| 2019 | $9,797 | $1,709,800 | $1,404,000 | $305,800 |
| 2018 | $9,438 | $1,709,800 | $1,404,000 | $305,800 |
| 2017 | $9,060 | $1,632,500 | $1,352,000 | $280,500 |
| 2016 | $8,734 | $1,632,500 | $1,352,000 | $280,500 |
| 2015 | $8,571 | $1,632,500 | $1,352,000 | $280,500 |
| 2014 | $8,456 | $1,632,500 | $1,352,000 | $280,500 |
Source: Public Records
Map
Nearby Homes